Weekly Market Updates
“At the Risk of Repeating Myself”
Well from our mouth to God’s ears because last Friday the S&P 500 (SPX/2759.82) vaulted above the 2740 overhead resistance level we wrote about. Support is now visible at the SPX’s 200-day moving average (DMA) of 2673.63, as well as its 50-DMA (2723.91). The next upside hurdle should be at the 2790 – 2800 level (chart 2), which we continue to think will be traversed in the weeks ahead with a trading target to the all-time high of 2872.87. The underlying “internal energy” mix is certainly constructive and suggestive of a decent upside move from here. Quite frankly, by our work there just is not much negative energy floating around currently to push prices back down to the 2700 level unless we get some negative / unexpected news. Indeed, our work suggests the anticipated corrective phase that began in January (we called the 2/9/18 intraday low) is over, as our trend model is positive and sentiment is bearish (read: bullishly). Typically, in mid-term election years the summer stock market action is trendless, but tends to make up for the summer doldrums as we approach the fall months.
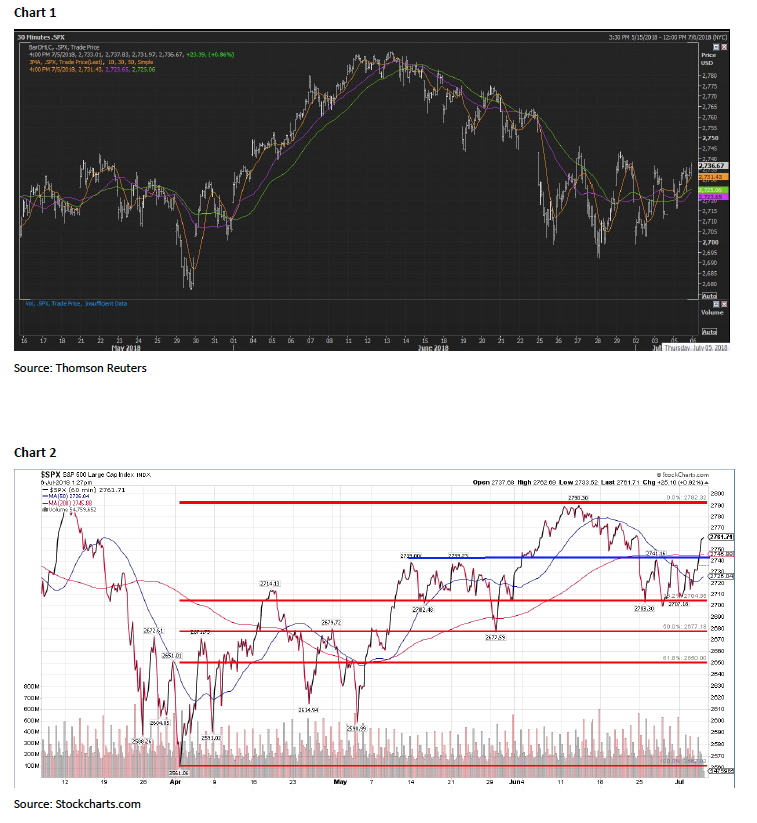
Clearly the stock market’s “internals” are pretty perky with the NYSE Advance/Decline Line continuing to point the way higher, and in the process made yet another new all-time high last week (chart 3). Also of interest is that the D-J Utility Average, and the iShare Real Estate ETF (IYR/$82.09), have broken out to the upside in the charts, which is amazing given the higher interest rate environment. Also interesting is that after our 18-month bearish stance on the over-priced defensive stocks, like Utilities, Consumer Staples, etc., that complex has turned up in the charts and is finally worthy of portfolio purchase consideration. As our pal Leon Tuey emailed us over the weekend:
Many charlatans always try to exploit people’s “negative bias” to attract attention and to sell their service. But as you say, they do serve a useful purpose as a sentiment indicator. Although long retired, many around the world continue to contact me seeking my views on the market. That is very useful as it gives me an insight to investor sentiment. I can tell you that globally, investors are gripped by fear; they are all concerned with the well-advertised “problems.” Yet, notice how bullishly the market is behaving? While many are groaning about the market’s lack of progress this year, little do they realize that the “the market” has been hitting record highs. Last week, the Advance-Decline Lines closed at record highs. Speaking of sentiment, I love the fact that for two weeks in succession, the AAII Sentiment Survey showed that Bullish sentiment fell below 30%, a low and bullish reading.
Also interesting is that the IYR also closed at a record high, but not surprising for I’ve been bullish on this sector since 2012. Strength in the IYR is encouraging and is very bullish. As you know, it is interest-sensitive. Therefore, it usually peaks before the major market indices. Despite the gains already achieved, (Leon believes) the IYR will move substantially higher yet in the years ahead. Everybody is sitting around waiting for “clarity,” not realizing that the bull market resumed long ago, back in early February. When the major market indices break out to new highs, they will either get really excited trying to get in, or they will complain about the market being over-extended.
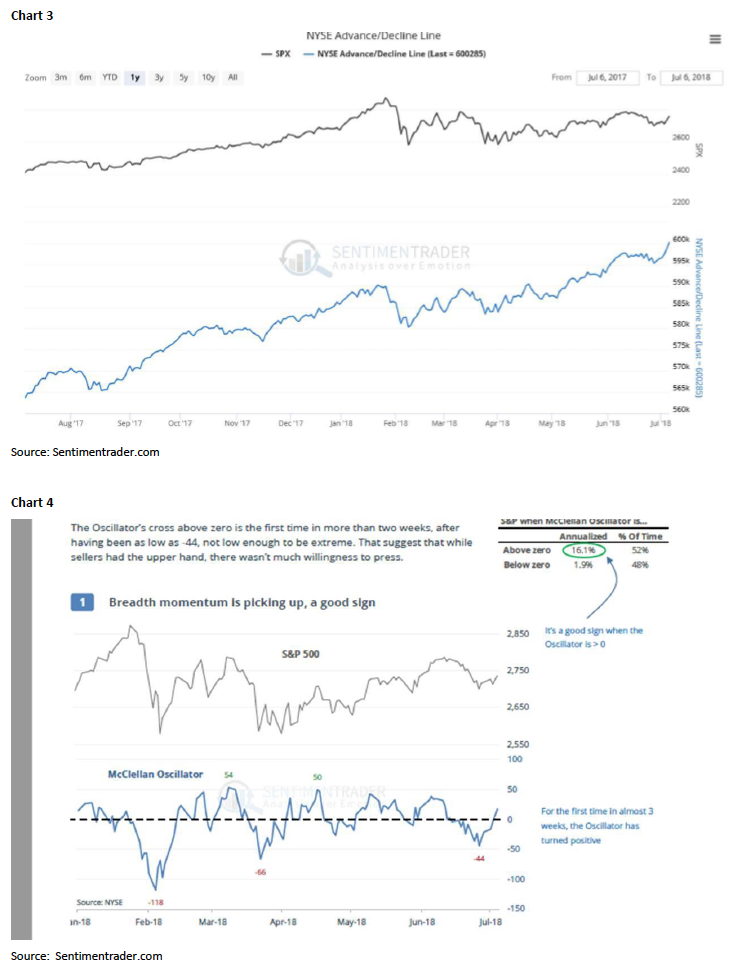
Further, last week there were new lows in the Selling Pressure Index and new highs in Buying Power Index. Moreover, the percentage of stocks above their respective 10-DMAs reached a new oversold condition last week that helped support Friday’s rally. According to the invaluable Lowry’s Research Organization, “[That rally] triggered a new buy-signal on July 5th when the 14-day Stochastic crossed above its moving average.” And as the always insightful Jason Goepfert (SentimenTrader) wrote on Friday:
On a shorter-term time frame, stocks are back in a healthy environment. At least, that’s the message being sent by the popular McClellan Oscillator. The indicator is essentially a peak at the momentum of the daily swings in market breadth by comparing two moving averages. When it’s above zero (but not too far above), it’s a good sign for stocks going forward (chart 4 on page 3). We can see from the table to the right that since 1962, the S&P 500 has retuned an annualized 16.1% when the Oscillator is above zero, versus only 1.9% when it’s below. The Oscillator’s cross above zero is the first time in more than two weeks, after having been as low as -44, not low enough to be extreme. That suggests that while sellers had the upper hand, there wasn’t much willingness to press.
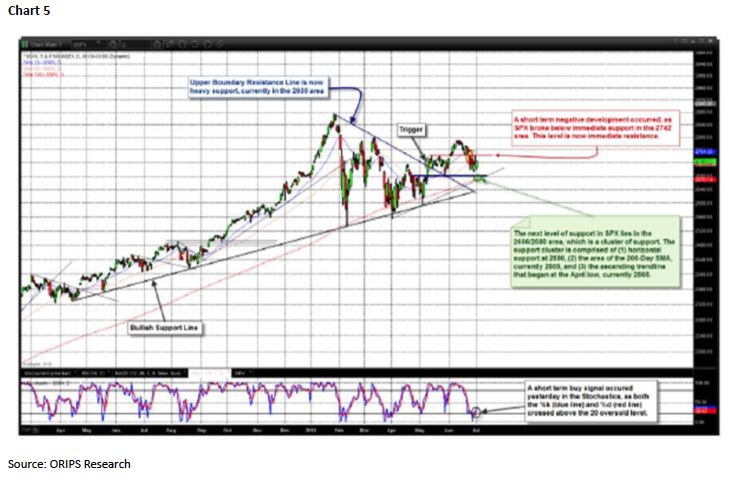
To summarize, the upside “chart trigger” signal of May 10th, when the SPX broke out of its wedge chart formation (chart 5 on page 5), suggests the primary stock market uptrend has resumed with an upside trading target above the old all-time high of 2872.87. This view is reinforced by new reaction highs in the RUT, the NDX, and the COMPQ.
The call for this week: We are bullish and if you are looking for stocks that are favorably rated by our fundamental analysts, and screen well under our proprietary models, some of them are: Extra Space Storage (EXR/$100.76/Outperform); Hess (HES/$67.55/Outperform); Genesse & Wyoming (GWR/$83.28/Strong Buy); and Salesforce (CRM/$141.40/Strong Buy). This morning the preopening S&P 500 futures are better by 10 points as we write at 5:11 a.m. on no real overnight news.