Weekly Market Updates
Down the Rabbit Hole
When we were kids, we used to love having our parents read to us, especially from books written by Lewis Carroll. Through the Looking Glass and Alice in Wonderland were our two favorites. One of the quotes that has always stuck with us is, “Down the rabbit hole,” which is a metaphor for an entry into the unknown, the disorienting, or the mentally deranging, from its use in Alice’s Adventures in Wonderland. Unfortunately, the same can be said about the stock market recently. Another quote from the movie “1984” is, “Numbers mean what we say they mean!” And we were reminded of that quote while reading a blog from one of Wall Street’s finest, John Murphy, over the weekend. The headline read, “The first quarter wasn’t that bad for stocks – the Vanguard Total Stock Market ETF (VTI/135.72) loss less than 1%.” The byline went on to say:
Despite all the volatility during the first quarter, the first three months of 2018 weren’t really that bad. The Dow Industrials were the biggest losers with a quarterly drop of -2.5%. The broader S&P 500 Index lost only -1.2%. While the tech dominated Nasdaq Composite gained 2.3%. Small caps saw only a marginal loss (-0.40%). The daily bars in Chart 1 [not included] shows the Vanguard Total Stock Market ETF. As its name implies, the VTI captures the entire stock market by size (large, small, and midsize) and by style (growth and value). And it lost only -0.71% from the end of December to the end of March.
While all of those numbers a correct, where you stand is a function of where you sit, and as George Orwell wrote, “Numbers mean what we say they mean!” As stated, all the aforementioned numbers are correct if you measure from December 31, 2017.
However, if you measure from the stock market’s peak of January 26, 2018, the decline in the VTI has been roughly 7%. Yet, the carnage beneath the surface has been much worse. Verily, in last Thursday’s “Morning Tack”, we noted:
From Election Day 2016 through the S&P 500’s last all-time high on January 26, the index added $6.3 trillion in market cap to take its total market cap up to $25.46 trillion. Since the high on 1/26, the index has now lost $2.34 trillion in market cap, bringing the total down to $23.12 trillion. This means that 37% of the post-Trump gains in market cap have been erased during the current market pullback.
Indeed, in Big Tech over the past few weeks, the losses have been egregious. For example, Big Tech has lost $278 billion dollars in stock market value since the Facebook face plant. The loss numbers, according to the invaluable Axios service, are “Facebook $75 billion, Amazon $61 billion, Apple $54 billion, Google $62 billion, and Microsoft $26 billion.” However, we have often noted that when the market leaders finally “give up the ghost”, you are typically near the end of a decline, and that hopefully seems to be the case here. We have been steadfast in the belief that the S&P 500 (SPX/2640.87) would NOT retest its intraday low of 2532.69, a level which we told investors to buy, and it has not retested that level since then. We have also been of the belief that the lows are “in” and that the second “leg” of the secular bull market remains in place.
Recall, we believe the first leg began in October of 2008 and ended in May 2015. The second leg began in February 2016 when The Royal Bank of Scotland told investors to “Sell everything but high grade bonds”, one of the great wrong-footed “calls” of all-time! How long the second leg will last is unknowable, but when it ends, it should be followed by an upside consolidation and then an upside breakout for the third leg of the secular bull market. As often stated, the third leg of the 1982-2000 secular bull market began in late 1994 and lasted until the spring of 2000.
Moreover, after being pretty bullish for much of 2017, our intermediate/short-term models telegraphed that last February was the first point of downside vulnerability in over 18 months, and we advised raising some cash on a trading basis.
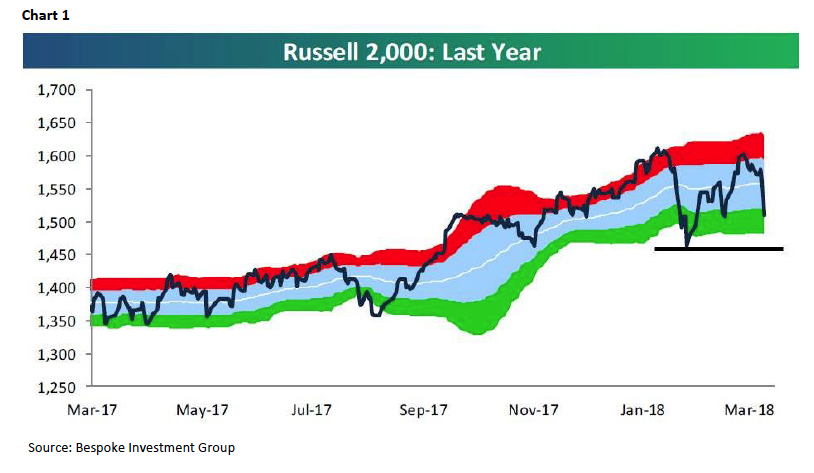
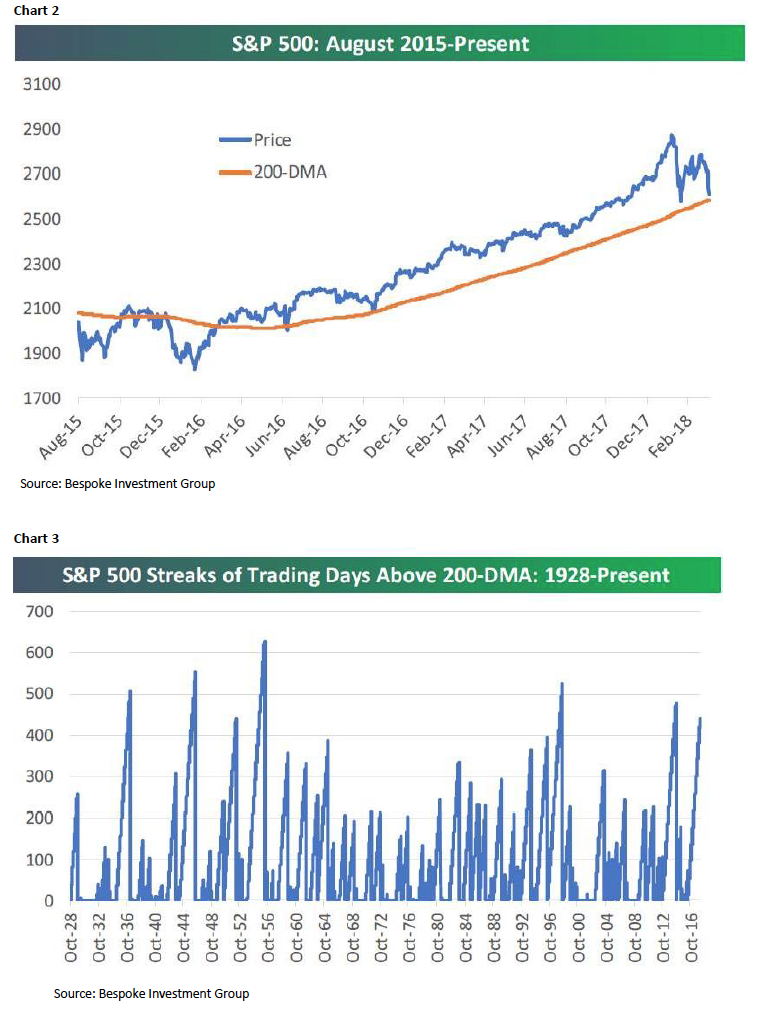
Subsequently, we put some of that cash back to work, mainly in the midstream MLPs, at the February “undercut low” of 2/9/18. It is worthy of mention that the Advance-Decline Line has not confirmed the 12% drop from the SPX’s intraday highs to its intraday low. This is likely due to the outperformance of the small/mid-capitalization stocks (Chart 1 on the following page). Despite the February/March gyrations, the SPX still resides above its 200-day moving average (Chart 2 on page 3) for a streak of 443 sessions above that MA. Since 1928, there have only been six other such 400+ session strings; truly remarkable and it demonstrates the power of this secular bull market (Chart 3 on page 3). It is interesting to observe that the percentage of S&P 500 industry groups above their respective 200-DMAs is only 37.5% and that the percentage above the 50-DMA is zero! Likewise, the percentage of stocks above their respective 50-DMAs is a mere 15%. Equally amazing is that ALL of the international Exchange Traded Funds (ETFs) we monitor are in oversold territory.
The call for this week: Yesterday was Easter Sunday, as well as the beginning of the new month, so the wakeup call was “rabbit, rabbit, rabbit” to begin the month as the stock market hopefully emerges from its “down the rabbit hole” decline,
which was the worst quarterly performance in two years. If the SPX can produce an upside follow-through rally to Friday’s Fling (+254 Dow Points) and cause the SPX to close above the 2660-2670 zone, and stay there, the trying times should be over. This morning, however, the SPMs are down 7 points on the China tariff news, the leaked Facebook memo, President Trump’s harangues at Amazon, and the U.S.’s potential exit from NAFTA. Tesla’s recall is also a negative.