


Weekly Market Updates
Investment Strategy: “Graham & Dodd vs. Edwards & Magee”
Despite the individualized journey, though, battle lines are generally formed between those who practice more value-based fundamental analysis and those who practice price-based technical analysis. Both disciplines can obviously be used together, but most people in this business probably do lean either more one way or the other, hence the friendly friction between the two schools of thought.
To greatly oversimply things, the “fundamentalists” are commonly followers of Benjamin Graham and David Dodd, the noted Columbia Business School professors who wrote the seminal book Security Analysis back in 1934. Their work treated stocks as the businesses they represented, and they endeavored to uncover situations where the price of shares in a company diverged from the true intrinsic value of its business. “Technicians,” on the other hand, study Technical Analysis of Stock Trends written by Robert D. Edwards and John Magee in 1948 and believe that stocks are just pieces of paper and the prices paid for them at any given time are the true “values” of the companies. Technical analysts argue that the fundamentals don’t make you any money unless the market agrees with your assessment of those fundamentals, and even if one’s fundamental opinion is correct and the price moves to the intrinsic value, it will be reflected in the charts anyway so the technically inclined can take advantage of the move as well. Fundamentalists, of course, retort that the true value of a company can be known in advance of a price move, which potentially allows for getting in or out before the chartists start picking up on any changes in trend. It’s also tough to argue against a strategy that turned Graham & Dodd disciple, Warren Buffett, into the world’s wealthiest person!
Doug Kass of Seabreeze Partners touched on a similar discussion in a comment last Friday that pondered whether investors and traders should be reactionary (more technical) or anticipatory (more fundamental). His conclusion was: “It can be debated which is the proper strategy…[but] I believe they can coexist.” We very much agree and think the two disciplines should coexist and be used together to form an investment opinion. We tend to be more reactionary on a longer-term basis but anticipatory on a shorter-term basis, and the combination has mostly worked well for us.
However, the Edwards & Magee crowd have most certainly won out over the last year, as the stock market has largely traded higher despite consistent calls from the Graham & Dodd contingent that the aggregate value of companies does not justify the current price level. The charts support the view that the long-term uptrend remains intact and the recent weakness is little more than a harmless pullback at this point. The Graham & Dodd believers, conversely, have intensified their warnings over the last two weeks, as they argue this down-move is only the beginning of a larger market adjustment.
Unfortunately, there exists no 100% accurate method; we, therefore, try to separate out and weigh as many factors as we can to see which direction the odds favor over various time horizons. At this stage, it is important to realize that all we’ve been dealt so far is a 2.82% dip on an intraday basis, so we think it’s much too early to mourn the death of the secular bull market. Remember, other than an overheated market pausing to cool off, little has changed from just a couple weeks ago. Specific events are always given credit for causing market moves, but it is funny how these events seem to come out of “nowhere” just as the technicals are indicating a change is likely due. Looking beyond the headlines, though, there really has not been a noticeable change in the overall conditions that have driven stocks to higher prices since the February 2016 lows: the U.S. economy is still reflecting okay, but not great growth; earnings season was strong even if the results were largely already priced in; and really no part of our overall secular bull market thesis has been interrupted by the action over the last two weeks. Instead, a convergence of negative news items have arrived at a time when there are few earnings releases or other positive fundamental news to help counter the bad sentiment and during a pre-Labor Day period when volumes tend to dry up anyway.
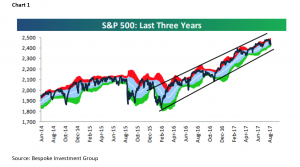
As Bespoke Investment Group notes: “We continue to treat the current pullback as more of a seasonal thing than anything else, given the market’s historical tendency to do poorly in August and September. Remember, from an earnings or economic or Fed perspective, things look the same now as they did a few weeks ago.” They also point out that, until Friday, the S&P 500 hadn’t traded in “oversold” territory for 196 straight trading sessions, the 9th longest streak since 1928 and the longest since the 333-trading day run from December 1994 to April 1996 (“oversold” territory, in this case, refers to moving more than one standard deviation below the 50-day moving average; chart 1). The point is, periods with practically no downside volatility like the one we’ve enjoyed since just before the presidential election last year are rare and must come to an end. That does not, however, mean the secular bull market has to come to an end at the same time. Bespoke looked at the 16 other streaks of 150+ trading days without the S&P 500 becoming oversold in history and all 16 of those times the index was higher three months later with an average gain of 4.80%.
So, we do maintain our cautious short-term stance for now since we have yet to really see signs of a clear bottom having been made, but we continue to advise against getting too bearish at this stage. It still feels unlikely we’re going to suddenly go from the market not being able to sell off at all, right into a major correction, which means most portfolios should maintain much of their exposure to stocks. That said, the upside may, admittedly, be limited in the near-term given seasonality and technical resistance, so some investors may feel more comfortable raising stops, hedging against the downside, and even raising some more cash just in case. Again, we believe the heavy support areas in the S&P 500 will help prevent major damage, but with a fairly balanced near-term risk-to-reward setup, an investor’s risk tolerance will determine how aggressive or conservative they get at this time.
For those deciding to hold a little more cash than usual, it may make sense, depending on the account type and fee structure, to explore alternatives to just having the money sitting there not really earning much. One such option is the Putnam Short Duration Income Fund (PSDYX for advisory accounts/PSDTX for traditional brokerage accounts), which, while not a money market fund, does have a stable NAV history and is easy to buy in and sell out of when looking to raise and deploy “cash.” The combination of the very short duration and the fund’s yield might make for an attractive alternative to other cash placeholders, but again, please research the fund further to ensure it meets the requirements of the portfolio and account type.
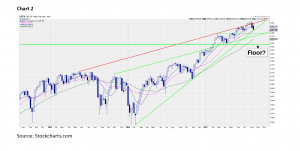
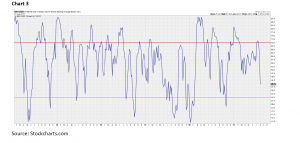
The call for this week: The current dip has, so far, taken the S&P 500 down to our first probable support zone around 2417- 2420 where sits the 100-day moving average and the support trendline connecting the February 2016 and November 2016 lows (Chart 2). At the same time and as previously mentioned, the index is oversold more than one standard deviation under its 50-day moving average for the first time since just before the U.S. presidential election last year and there likely exists additional support just above 2400, so the buy-the-dip crowd may make an early-week attempt to boost the market back up. Nevertheless, practically all of the market breadth indicators we follow are still pointed down and not yet at “washout” levels that have historically marked bottoms (Chart 3), indicating selling pressure may not have been exhausted quite yet.
SentimenTrader does note, though, that with half of all Energy stocks in the S&P 500 hitting new 52-week lows last week, the sector may be nearing its own selling climax and a bottom there would go a long way toward helping the breadth readings for the entire market. So, this week we will be watching for signs that investors are stepping in to buy the pullback across the market, boosting up the breadth indicators and keeping the major averages above their respective probable support levels.
Important Investor Disclosures
Raymond James & Associates (RJA) is a FINRA member firm and is responsible for the preparation and distribution of research created in the United States. Raymond James & Associates is located at The Raymond James Financial Center, 880 Carillon Parkway, St. Petersburg, FL 33716, (727) 567-1000. Non-U.S. affiliates, which are not FINRA member firms, include the following entities that are responsible for the creation and distribution of research in their respective areas: in Canada, Raymond James Ltd. (RJL), Suite 2100, 925 West Georgia Street, Vancouver, BC V6C 3L2, (604) 659-8200; in Europe, Raymond James Euro Equities SAS (also trading as Raymond James International), 40, rue La Boetie, 75008, Paris, France, +33 1 45 64 0500, and Raymond James Financial International Ltd., Broadwalk
House, 5 Appold Street, London, England EC2A 2AG, +44 203 798 5600.
This document is not directed to, or intended for distribution to or use by, any person or entity that is a citizen or resident of or located in any locality, state, country, or other jurisdiction where such distribution, publication, availability or use would be contrary to law or regulation. The securities discussed in this document may not be eligible for sale in some jurisdictions. This research is not an offer to sell or the solicitation of an offer to buy any security in any jurisdiction where such an offer or solicitation would be illegal. It does not constitute a personal recommendation or take into account the particular investment objectives, financial situations, or needs of individual clients. Past performance is not a guide to future performance, future returns are not guaranteed, and a loss of original capital may occur. Investors should consider this report as only a single factor in making their investment decision.
For clients in the United States: Any foreign securities discussed in this report are generally not eligible for sale in the U.S. unless they are listed on a U.S. exchange. This report is being provided to you for informational purposes only and does not represent a solicitation for the purchase or sale of a security in any state where such a solicitation would be illegal. Investing in securities of issuers organized outside of the U.S., including ADRs, may entail certain risks. The securities of non-U.S. issuers may not be registered with, nor be subject to the reporting requirements of, the U.S. Securities and Exchange Commission. There may be limited information available on such securities. Investors who have received this report may be prohibited in certain states or other jurisdictions from purchasing the securities mentioned in this report.
Please ask your Financial Advisor for additional details and to determine if a particular security is eligible for purchase in your state.
The information provided is as of the date above and subject to change, and it should not be deemed a recommendation to buy or sell any security. Certain information has been obtained from third-party sources we consider reliable, but we do not guarantee that such information is accurate or complete. Persons within the Raymond James family of companies may have information that is not available to the contributors of the information contained in this publication. Raymond James, including affiliates and employees, may execute transactions in the securities listed in this publication that may not be consistent with the ratings appearing in this publication.
Raymond James (“RJ”) research reports are disseminated and available to RJ’s retail and institutional clients simultaneously via electronic publication to RJ’s internal proprietary websites (RJ Investor Access & RJ Capital Markets). Not all research reports are directly distributed to clients or third-party aggregators. Certain research reports may only be disseminated on RJ’s internal proprietary websites; however such research reports will not contain estimates or changes to earnings forecasts, target price, valuation, or investment or suitability rating. Individual Research Analysts may also opt to circulate published research to one or more clients electronically. This electronic communication distribution is discretionary and is done only after the research has been publically disseminated via RJ’s internal proprietary websites. The level and types of communications provided by Research Analysts to clients may vary depending on various factors including, but not limited to, the client’s individual preference as to the frequency and manner of receiving communications from Research Analysts. For research reports, models, or other data available on a particular security, please contact your RJ Sales Representative or visit RJ Investor Access or RJ Capital Markets.
Additional information is available on request.
Analyst Information
Registration of Non-U.S. Analysts: The analysts listed on the front of this report who are not employees of Raymond James & Associates, Inc., are not registered/qualified as research analysts under FINRA rules, are not associated persons of Raymond James & Associates, Inc., and are not subject to FINRA Rule 2241 restrictions on communications with covered companies, public companies, and trading securities held by a research analyst account.
Analyst Holdings and Compensation: Equity analysts and their staffs at Raymond James are compensated based on a salary and bonus system. Several factors enter into the bonus determination including quality and performance of research product, the analyst’s success in rating stocks versus an industry index, and support effectiveness to trading and the retail and institutional sales forces. Other factors may include but are not limited to: overall ratings from internal (other than investment banking) or external parties and the general productivity and revenue generated in covered stocks.