


Weekly Market Updates
Investment Strategy: “Career Risk vs. Portfolio Risk”
We recalled these sage words from GMO’s (Grantham, Mayo & Van Otterloo) Jeremy Grantham as we watched the end of the quarter performance gaming and portfolio restructuring late last week. His comments are particularly cogent now that we have entered the month of October, since many money management firms close their fiscal year “books” at the end of this month. Consequently, there is much angst regarding performance risk, bonus risk, and ultimately career risk (loss of job).
Indeed, keeping up with the Joneses, that would be the Dow Joneses, has been difficult for portfolio managers this year.
Now we are not so sure this herding trend has “pushed prices further away from fair value” for as we have argued in past missives we don’t think stocks are all that expensive. To wit, given there are more high growth companies in the S&P 500 than ever before, the tectonic shift from tangible assets on corporate balance sheets to intangible assets, and the fact that since 1990 the S&P 500’s average P/E ratio has been over 20 times earnings; but, we digress. Despite these end of the quarter machinations, the more strategic theme is that pension funds, endowment funds, sovereign funds, etc. are figuring out the only way they can ever achieve their targeted annual return of say 7.5% is to increase their exposure to equities. To be sure, there is no way to get to that return in bonds because it is mathematically impossible. So their sole focus is to attempt to get back to a 7.5% annualized return.
To this point, our friend, and perspicacious Dallas-based portfolio manager Frederick “Shad” Rowe (Greenbrier Partners) shared this with us a few years ago:
We’ll look at 20 year [returns] starting in 1965, then 20 years [forward] starting in 1966, and so on. Returns on investments in the S&P 500 stock index for each period have fluctuated between 8% and 12%. Each period contained some bad years, but there were always more good years and they outweighed the bad results for every 20-year stretch. While the actuarially assumed rate of return for most public pension systems is approximately 7.5%, the stock market has managed to climb the proverbial wall of worry and offer superior returns, compared to virtually all available alternatives – if you stayed fully invested in the index for the full 20 years.
As for Andrew and I, we have never wavered since our long-term proprietary model flipped positive in October of 2008 that a new secular bull had begun. While most believe it began in March 2009, the majority of stocks bottomed on October 10, 2008 when 92.6% of all stocks traded on the NYSE made new annual lows. Granted the major indices went lower into March 2009, but that was because the Financials went lower and we were bullish. Since then we have averred the equity markets are in a secular bull market that has years left to run. This first leg of the secular bull market ended in May 2015, which was followed by an upside consolidation until the second leg began in February 2016, which at the time the Royal Bank of Scotland told investors to sell everything but high grade bonds. The second leg of a secular bull market is the longest, and the strongest, being driven by the accommodative Fed monetary policy that produced the first leg, and the transition to an
improving economy, and an “earnings driven” secular bull market.
For the record, we have NEVER failed to believe that the secular bull market has years left to run. With that as our strategic strategy, we have attempted to fine-tune the trading metrics within our secular bull market “call.” On a trading basis, this year we have generally been much more right than wrong, but when we are wrong we say we are wrong. Accordingly, our cautious stance since the beginning of August, when our short/intermediate models turned cautious, appeared right until last
week when many of the major indices we track broke out to new all-time highs. While last week proved our cautious trading strategy wrong-footed, one thing we got right over the past month was to buy the energy stocks.
The Energy sector has improved noticeably since we turned positive on it. As the eagle-eyed Jason Goepfert (SentimenTrader) notes:
Energy stock boost. In mid-August, more than half of energy stocks had plunged to a year-long low. Since then, the energy sector has rallied most of the past 30 days, with excellent gains. Coming off a low point, such focused buying pressure has usually led to further gains, with an excellent risk/reward profile over the next 6-12 months. Another minor boost is that crude oil futures have moved into backwardation (definition), but that was a better indicator for oil itself rather than energy stocks.
We have been particularly interested in the midstream MLPs (master limited partnerships) because they got dragged lower when the upstream MLPs imploded due to their price sensitivity to crude oil. While some of the midstreams have limited sensitivity to the price of oil, many do not. For ideas we suggest consulting our Houston-based MLP analysts.
In conclusion, we return to these insightful words from Shad’s recent letter to clients:
The stock market tends to be a predictor of future economic change, discounted back to the present. Our take is that there are great things taking place that are not readily apparent. Behind the political noise of the day, our companies are participating in one of the greatest growth and productivity surges the world has ever seen. Interestingly, this technological leap forward is taking place at the same time that increasing transparency (made possible by technology) is making it more fashionable to do the right thing. Even a small shift toward more ethical behavior opens up an even bigger opportunity for American companies operating throughout the world, further validating our
“Americanization” theory. In short, we see plenty of reasons why the current bull market could be extended. . . . Here is the question I keep asking myself: “Where are we? In the year 2000 when the dot.com bubble was about to burst and keeping lots of dry powder paid off; or, how about 1455 with the invention of movable type (enabling the printing of the Gutenberg Bible) and the explosion of mankind’s ability to communicate; or, 1820 and the commercialization of the steam engine?” My answer is that this is not a bubble. The period we are currently in represents as significant a leap forward in technology and productivity as the world has ever seen.
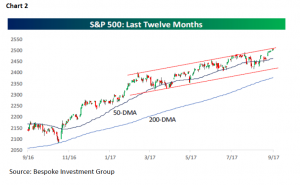
The call for this week: Well, quarter-end performance gaming and portfolio restructuring is over and the beginning of the fourth quarter is at hand. The indicators are showing extreme optimism (Chart 1) and the S&P 500 (SPX/2519.36) is at the top end of its channel (Chart 2). Meanwhile, our short-term model flipped positive last week, but our intermediate model remains negatively configured (read: confused). Accordingly, this week should tell us if we are totally wrong on a trading basis, or just wrong for a week.

Important Investor Disclosures
Raymond James & Associates (RJA) is a FINRA member firm and is responsible for the preparation and distribution of research created in the United States. Raymond James & Associates is located at The Raymond James Financial Center, 880 Carillon Parkway, St. Petersburg, FL 33716, (727) 567-1000. Non-U.S. affiliates, which are not FINRA member firms, include the following entities that are responsible for the creation and distribution of research in their respective areas: in Canada, Raymond James Ltd. (RJL), Suite 2100, 925 West Georgia Street, Vancouver, BC V6C 3L2, (604) 659-8200; in Europe, Raymond James Euro Equities SAS (also trading as Raymond James International), 40, rue La Boetie, 75008, Paris, France, +33 1 45 64 0500, and Raymond James Financial International Ltd., Broadwalk
House, 5 Appold Street, London, England EC2A 2AG, +44 203 798 5600.
This document is not directed to, or intended for distribution to or use by, any person or entity that is a citizen or resident of or located in any locality, state, country, or other jurisdiction where such distribution, publication, availability or use would be contrary to law or regulation. The securities discussed in this document may not be eligible for sale in some jurisdictions. This research is not an offer to sell or the solicitation of an offer to buy any security in any jurisdiction where such an offer or solicitation would be illegal. It does not constitute a personal recommendation or take into account the particular investment objectives, financial situations, or needs of individual clients. Past performance is not a guide to future performance, future returns are not guaranteed, and a loss of original capital may occur. Investors should consider this report as only a single factor in making their investment decision.
For clients in the United States: Any foreign securities discussed in this report are generally not eligible for sale in the U.S. unless they are listed on a U.S. exchange. This report is being provided to you for informational purposes only and does not represent a solicitation for the purchase or sale of a security in any state where such a solicitation would be illegal. Investing in securities of issuers organized outside of the U.S., including ADRs, may entail certain risks. The securities of non-U.S. issuers may not be registered with, nor be subject to the reporting requirements of, the U.S. Securities and Exchange Commission. There may be limited information available on such securities. Investors who have received this report may be prohibited in certain states or other jurisdictions from purchasing the securities mentioned in this report.
Please ask your Financial Advisor for additional details and to determine if a particular security is eligible for purchase in your state.
The information provided is as of the date above and subject to change, and it should not be deemed a recommendation to buy or sell any security. Certain information has been obtained from third-party sources we consider reliable, but we do not guarantee that such information is accurate or complete. Persons within the Raymond James family of companies may have information that is not available to the contributors of the information contained in this publication. Raymond James, including affiliates and employees, may execute transactions in the securities listed in this publication that may not be consistent with the ratings appearing in this publication.
Raymond James (“RJ”) research reports are disseminated and available to RJ’s retail and institutional clients simultaneously via electronic publication to RJ’s internal proprietary websites (RJ Investor Access & RJ Capital Markets). Not all research reports are directly distributed to clients or third-party aggregators. Certain research reports may only be disseminated on RJ’s internal proprietary websites; however such research reports will not contain estimates or changes to earnings forecasts, target price, valuation, or investment or suitability rating. Individual Research Analysts may also opt to circulate published research to one or more clients electronically. This electronic communication distribution is discretionary and is done only after the research has been publically disseminated via RJ’s internal proprietary websites. The level and types of communications provided by Research Analysts to clients may vary depending on various factors including, but not limited to, the client’s individual preference as to the frequency and manner of receiving communications from Research Analysts. For research reports, models, or other data available on a particular security, please contact your RJ Sales Representative or visit RJ Investor Access or RJ Capital Markets.
Additional information is available on request.