


Weekly Market Updates
Investment Strategy: “Charts of the Week”
As per Wikipedia, “Festivus is a secular holiday celebrated on December 23 as an alternative to the pressures and commercialism of the Christmas season…and includes a Festivus dinner, an unadorned aluminum Festivus pole, practices such as the ‘Airing of Grievances’ and ‘Feats of Strength,’ and the labeling of easily explainable events as ‘Festivus miracles.’” However, any investors who may have taken part in the Festivus festivities likely did not include the stock market in their list of grievances to air, unless they happened to be bearish or spent the whole year waiting to buy the dip that never came. Moreover, the biggest “feat of strength” in 2017 may have been the S&P 500’s outright refusal to fall even 3% from a previous high – a record streak that is now over 400 days long and counting – and it would probably require a “Festivus miracle” for that streak to end in the closing sessions of the year.
The market’s run of limited volatility isn’t the only interesting data point we have come across, though. The following stats help to summarize just how crazy 2017 has been and put the current stage of the bull market into larger context:
- On a total return basis, the S&P 500 has been up every month in 2017 (barring a late December collapse). There has never been a full calendar year when the index gained every month. In total, the index will have been up for 14 straight months on a total return basis if it finishes December higher. There have been three prior periods where the S&P was up for 12 or more straight Once those streaks came to an end, the S&P 500 was higher over the following six months every time and higher one year later two out of three times (source: Bespoke Investment Group).
- The S&P 500 has risen for nine consecutive quarters and in 18 out of the last 20 (including the quarter ending on 12/31/17). Astoundingly, 2008 was the only down year on a total return basis since 2002 (2011 and 2015 finished marginally lower on a price basis but were positive after dividends).
- There have only been seven sessions in 2017 in which the S&P 500 gained or lost 1% or more on a closing basis. The S&P 500 has never gained or lost more than 2% on a closing In 2009, there were 55 separate 2% up or down days and there were 35 in 2011 (source: A Wealth of Common Sense).
- The average absolute daily price change this year on the S&P 500 is just 31 basis If the year ended right now, that would be the lowest daily price change on record since 1965. (A Wealth of Common Sense)
- The worst peak-to-trough drawdown is just 8 percent this year. Over the past 100 years, the average intra-year drawdown in stocks has been around 16 percent. The shallowest calendar-year peak-to-trough drawdown was in 1995, when the worst loss in stocks was just 3.3 percent for the year. (A Wealth of Common Sense)
- The Dow Jones Industrial Average has hit 70 record highs in 2017, a new all-time record for one calendar year, passing 1995’s
Heading into Tuesday, 29% of S&P 500 companies were up at least 30% in 2017, 45% were up at least 20%. Feats of strength indeed! And with that, here are the Charts of the Week…
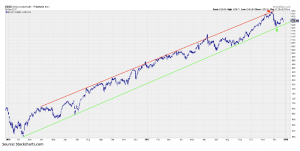
All is Quiet in the S&P 500
Not surprisingly, the last trading week of the year is often fairly dead and quiet. That was definitely the case yesterday as the S&P 500 barely moved. The “updated” resistance line we discussed last week has caused somewhat of a pause in the average and we might not get much real movement until traders return next year. We still are a little anxious to see if 2018 will be greeted by profit-taking as investors realize capital gains from this year, and we believe that to be the most likely cause of any weakness in the near term. Yet, once again, the ample support underneath the current S&P 500 level will hopefully prevent any major damage.

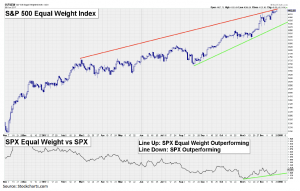
S&P 500 Equal Weight Index Outperforming
The regular, market cap weighted S&P 500 has paused, but the equal weight version hit yet another all-time high during yesterday’s session. In fact, the equal weight version has largely been outperforming the market cap weighted version since early November, reflecting that it’s not just the huge stocks performing right now. However, the equal weight version may be hitting its own resistance line here in the near-term (red line) that could force at least a pause.
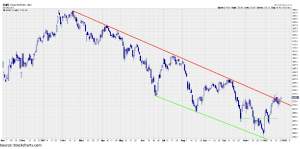
SOX Still Not Acting Right
It is always tough to know if we should believe trading action taking place during this slow time of year, but one possible cause for concern is the recent performance of the Semiconductor Index (SOX). As we have pointed out in recent weeks, it hit major resistance back in late November (red line) and subsequently took a dive. That was followed by somewhat of a bounce, but that bounce has now reversed back down and is again approaching the major support line from the lower end of its long-term channel (green line). Breaking below that lower support line would not be good, especially since the SOX can often signal forthcoming weakness in the broad market.
Energy Breakout
Energy has produced the most interesting price action in all of the major S&P 500 sectors lately, with what looks to be a clear breakout above a couple of very important resistance points over the last few trading days. First, energy was able to rise above a falling resistance line that had capped prices going back to mid-2014 (line 1) and then it impressively recovered a line that has a history acting as both support and resistance (line 2). The action, hopefully, bodes well for the beginning of 2018 for investors in energy stocks.

Similar Breakout in MLPs
We have mentioned over the last month that the MLPs may be of interest, and the price action in the group, similar to energy as a whole, has been positive lately. A clear price channel developed in the Alerian MLP index over the last year, but it now appears MLPs are breaking out above the top end of that channel. This, too, is hopefully a good sign for investors who have been anxiously awaiting a turn-around in the MLP complex. With as out of favor as the group has been, it may have quite a bit of upside should it once more become “loved” by the market.
Oil Eyeing $60
The price of WTI crude oil has mostly been flat the last few weeks, but it does seem destined to at least take a shot at getting and staying above $60. We continue to think resistance sits in that $60-62.50 zone, but obviously a breakout above there would be bullish for the price of oil.

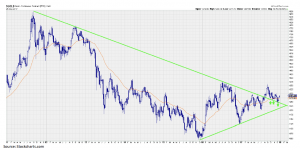
Gold Finally Showing Some Life
We have mentioned gold a few times over the last few months as it hugs what looks to be a fairly important support line (top green line), but the support really hasn’t produced the explosive thrust we expected. However, the recent action has been a little livelier and may indicate the metal is setting up for a more substantial move. Getting back above $1300 would be a step in the right direction for that to occur since it produced some minor resistance in November
Important Investor Disclosures
Raymond James & Associates (RJA) is a FINRA member firm and is responsible for the preparation and distribution of research created in the United States. Raymond James & Associates is located at The Raymond James Financial Center, 880 Carillon Parkway, St. Petersburg, FL 33716, (727) 567-1000. Non-U.S. affiliates, which are not FINRA member firms, include the following entities that are responsible for the creation and distribution of research in their respective areas: in Canada, Raymond James Ltd. (RJL), Suite 2100, 925 West Georgia Street, Vancouver, BC V6C 3L2, (604) 659-8200; in Europe, Raymond James Euro Equities SAS (also trading as Raymond James International), 40, rue La Boetie, 75008, Paris, France, +33 1 45 64 0500, and Raymond James Financial International Ltd., Broadwalk House, 5 Appold Street, London, England EC2A 2AG, +44 203 798 5600.
This document is not directed to, or intended for distribution to or use by, any person or entity that is a citizen or resident of or located in any locality, state, country, or other jurisdiction where such distribution, publication, availability or use would be contrary to law or regulation. The securities discussed in this document may not be eligible for sale in some jurisdictions. This research is not an offer to sell or the solicitation of an offer to buy any security in any jurisdiction where such an offer or solicitation would be illegal. It does not constitute a personal recommendation or take into account the particular investment objectives, financial situations, or needs of individual clients. Past performance is not a guide to future performance, future returns are not guaranteed, and a loss of original capital may occur. Investors should consider this report as only a single factor in making their investment decision.
For clients in the United States: Any foreign securities discussed in this report are generally not eligible for sale in the U.S. unless they are listed on a U.S. exchange. This report is being provided to you for informational purposes only and does not represent a solicitation for the purchase or sale of a security in any state where such a solicitation would be illegal. Investing in securities of issuers organized outside of the U.S., including ADRs, may entail certain risks. The securities of non-U.S. issuers may not be registered with, nor be subject to the reporting requirements of, the U.S. Securities and Exchange Commission. There may be limited information available on such securities. Investors who have received this report may be prohibited in certain states or other jurisdictions from purchasing the securities mentioned in this report. Please ask your Financial Advisor for additional details and to determine if a particular security is eligible for purchase in your state.
The information provided is as of the date above and subject to change, and it should not be deemed a recommendation to buy or sell any security. Certain information has been obtained from third-party sources we consider reliable, but we do not guarantee that such information is accurate or complete. Persons within the Raymond James family of companies may have information that is not available to the contributors of the information contained in this publication. Raymond James, including affiliates and employees, may execute transactions in the securities listed in this publication that may not be consistent with the ratings appearing in this publication.
Raymond James (“RJ”) research reports are disseminated and available to RJ’s retail and institutional clients simultaneously via electronic publication to RJ’s internal proprietary websites (RJ Investor Access & RJ Capital Markets). Not all research reports are directly distributed to clients or third-party aggregators. Certain research reports may only be disseminated on RJ’s internal proprietary websites; however such research reports will not contain estimates or changes to earnings forecasts, target price, valuation, or investment or suitability rating.
Individual Research Analysts may also opt to circulate published research to one or more clients electronically. This electronic communication distribution is discretionary and is done only after the research has been publically disseminated via RJ’s internal proprietary websites. The level and types of communications provided by Research Analysts to clients may vary depending on various factors including, but not limited to, the client’s individual preference as to the frequency and manner of receiving communications from Research Analysts. For research reports, models, or other data available on a particular security, please contact your RJ Sales Representative or visit RJ Investor Access or RJ Capital Markets.
Links to third-party websites are being provided for information purposes only. Raymond James is not affiliated with and does not endorse, authorize, or sponsor any of the listed websites or their respective sponsors. Raymond James is not responsible for the content of any third-party website or the collection or use of information regarding any website’s users and/or members.
Additional information is available on request.