Weekly Market Updates
Investment Strategy: “I Should Have”
I have used the aforementioned Fred Kelly quote off and on for nearly five decades, but I dredged it up again this morning since over the past five months I have received numerous voice mails/emails with the statement, “I should have!” To wit, “I should have raised cash on the October 2 trader’s “sell signal.” “I should have” bought the massive three session “selling climax” lows that ended on Christmas Eve in one of the most oversold readings I have seen in years. Since then the stock market rally has been legendary. The Dow Wow has lifted the senior index some 19%
+ from its intraday low into last Friday’s intraday high. Of course the obligatory question following “I should have” is “what should I do now?”
Well to that point, many pundits continue to suggest that we will get a retest of the Christmas lows of 2346 basis the S&P 500 (SPX/2775.60). However, there are many instances where a major low was never retested. The December 1974, October 1975, March 1978, November 1979 lows were never retested and I could name many more. More recently, the March 2009 lows were NEVER retested. Yet the negative nabobs keep insisting the December 2018 lows will get retested. Someone sent us this over the weekend:
“Several weeks ago we did some research to find out what a typical rally looks like after a big waterfall-like decline takes place. The takeaway was that the rallies after those waterfall declines have lasted anywhere from 1 to 74 days and have retraced 20-90+% of the initial decline. That’s quite a wide range in both duration and magnitude of the move, but a universal similarity was that in 19 of 19 post-war instances of a 15% uninterrupted decline (excluding the current one), the stock market ended up testing the waterfall low in some fashion. That is a pretty compelling statistic that flies in the face of what we are currently witnessing.”
The writer goes on to document that statement, but in my opinion uses the wrong dates to make his point. For example, he uses the September 1974 low of 584.56 on the D-J Industrials, but the actual low came in December 1974 at 577.60 and was never retested. Nonetheless, I remain pretty convinced that barring some kind of terrible “black swan” news, the December 2018 lows will not be retested.
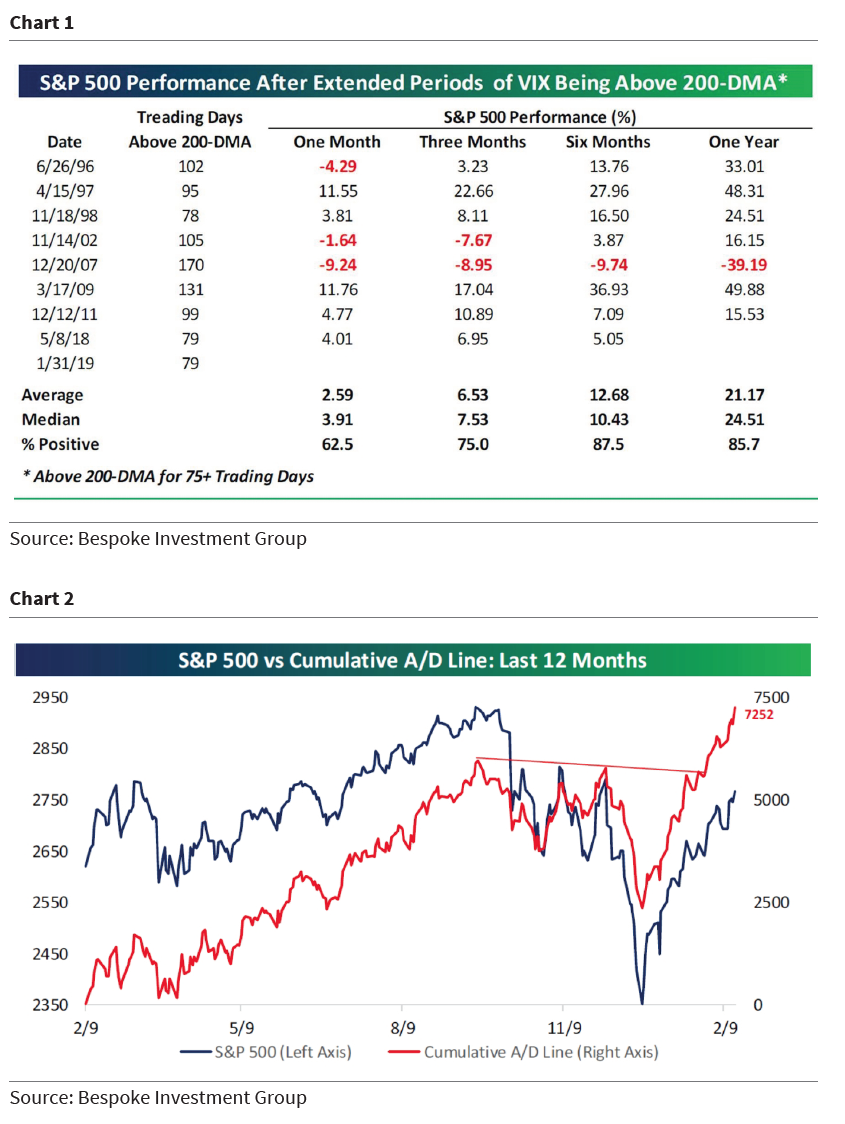
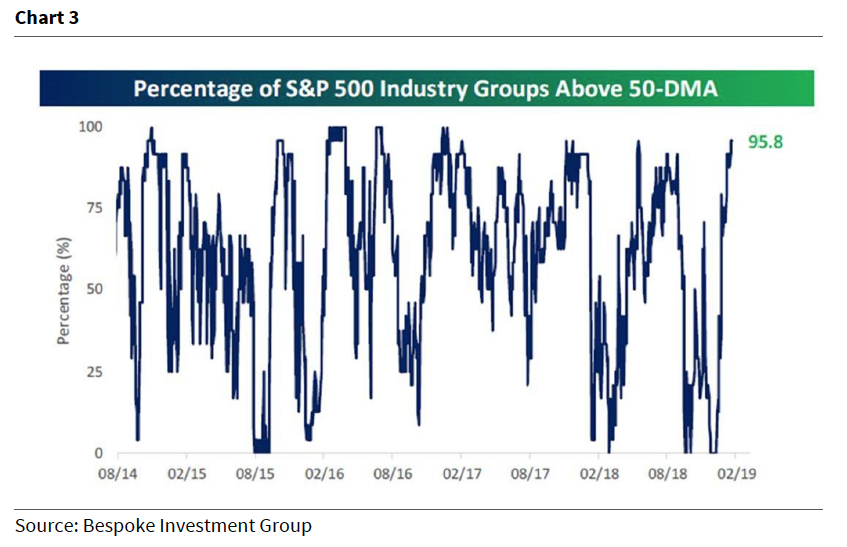
As for last week’s stock market, the SPX’s straight-up move left that index higher by 2.5% for the week and in the process eclipsed its 200-day moving average at 2744.88. Not to be outdone the Industrials (INDU/25883.25) rallied 3.1% and likewise closed decisively above their 200-DMA of 25035.68. Those 200-DMAs should now act as a support level. Interestingly, the Volatility Index (VIX/14.91) also tagged its 200-DMA of 16.51 last week, but failed to better it. However, it is worth watching the VIX for if it closes above the 200-DMA the performance by the SPX has been decent (Chart 1). Meanwhile, the S&P 500’s Advance-Decline Line continues to trade toward new highs (Chart 2), but the rally off the December lows has left most industries/indexes very overbought on a near-term basis (Chart 3). Given the stock strength one would think the economic backdrop would be pretty good, but that is just not the case. Take last week, the economic reports were either bad or terrible (industrial production, December retail sales, etc.). This caused the Citi Economic Surprise Index to record its biggest one day drop since January 2016. However, I am not paying much attention to the recent economic statistics because of the government shutdown.
To me, the recent stock market action looks like an upside “blow off” trading top. According to Investopedia:
“A blow-off top is a chart pattern that indicates a steep and rapid increase in a security’s price and trading volume followed by a steep and rapid drop in price and volume. The rapid changes indicated by a blow-off top, also called a blow-off move or exhaustion move, can be the result of actual news or pure speculation.”
The call for this week: Even though this feels like a “blow off trading top” I still do not think the December lows will be retested. The invaluable Lowry Research Organization agrees as they wrote over the weekend (as paraphrased):
Lowry identified nine instances since 1940 when their Short Term Index expanded this well from an oversold condition as it has since the December 2018 low. Seven occurred when the S&P 500 was below its 200-DMA and were roughly coincident with a new trend buy signal. The S&P 500 on average rallied some 35% over the next 12 months and 55% over the next two years.
This morning the preopening futures are flat as U.S. China trade talks make little progress. Yet, President Trump apparently decided that he had to spin the negative trade negotiation reports that appeared during Asian trading into something positive. DJT said the U.S. and China talks are going well; the parties are ‘a lot closer’ to making a trade deal and he might extend the March 1 deadline and hinted at an extension of the talks. Despite Friday’s Fling, there was a very negative NYSE breadth divergence which appeared during the final two hours of trading. It feels like a blow off trading top to me.