Weekly Market Updates
Investment Strategy: “Leonid Meteor Shower”
Similarly, a “meteor shower” is getting ready to “hit” Washington D.C. as the Mueller investigation is nearing its conclusion. Washington Whispers have it that some meteoric “bomb shells” are going to be revealed. What the impact will be on the equity markets is difficult to analyze, but in an attempt to do so, we reviewed our notes of 1972, 1973, and 1974. President Nixon was reelected in November of 1972, and shortly thereafter, the Watergate scandal news surfaced. In March-April of 1973, the scandal heated-up as Magruder admits perjury with the D-J Industrials trading around 1000. On April 17, 1973, Presidential News Secretary Ziegler declares all previous statements about Watergate are “inoperative”, leaving the Industrials at ~925. From there, the senior index bobs and weaves until eventually bottoming at 851.90 in August 1973 and then rallying back to 987.06 in October. On October 10, Vice President Agnew resigns, and on October 23, President Nixon announced he will release the Watergate tapes, and the Industrials began to slide. The slide subsided in December 1973 around 788 and stabilized there, followed by a throwback rally to 891 in March 1974 where a secondary stock slump began. That decline would see the Industrials fall to 577.60 on December 6, 1974 as the news backdrop read: more Watergate disclosers, President Nixon resigns, Franklin National Bank collapses in the biggest bank failure in U.S. history, the investing public pull in their horns as the economy sinks into the worst recession since the 1930s, new cars sales plunge 34%, housing starts are at an eight-year low, and Americans are allowed to legally buy gold.
It was in December 1974 we penned our first strategy report, noting that stocks were trading below “known values” and should be accumulated. For example, in 1974, there were stocks trading below cash per share. Another “tell” was when we called on Laurence Alan “Larry” Tisch (Chairman of Lowe’s Corporation) and asked him why he was buying shares of Overseas Ship Group. He responded, “Because I can buy the entire company out at its current market capitalization, melt down all the ships, and sell the scrap steel for three times what I am paying for the stock.” It was also in December 1974 that the D-J Industrials were smashed to a 12-year low, but the D-J Transportation Average refused to confirm the downside (a Dow Theory downside non-confirmation), and subsequently, a Dow Theory “buy signal” was registered and the 1973 to 1974 bear market ended.
So much for the history lesson. We wish we could tell you what the Mueller “bomb shells” will be, but we just do not know what the “Careless Whispers” are (thank you George Michael: Careless Whispers). We will posit it is doubtful President Trump will be impeached in a Nixon déjà vu, but the Trump organization could be in for a rough ride. How does that impact our stock market “call?” Well, quite frankly in the near term, it doesn’t. The October 2, 2018 short-term “sell signal” from our proprietary model was negated at the October 29, 2018 stock market low that Andrew Adams identified. We also called the subsequent throwback rally into the 2800-2820 zone, which we said would cap the rally followed by a secondary decline that should end above the “selling climax” low of October 29 (2603). There is a good chance that secondary low was made on Thursday of last week with the intraday print low of 2670.75, thus closing both of the upside chart gaps made by the S&P 500 (SPX/2736.27) in its dash from ~2603 to the trading top of ~2815. As the astute Lowry’s Research Organization writes:
Based on the forces of Supply and Demand, the market decline that followed the September 20th high has displayed few of the characteristics found in the early stage of a bear market, but has been consistent with a normal pause in an ongoing bull market. Overall, the decline has lacked signs of either intense buying or selling with only one 90% Down Day (October 10th) and no 90% or consecutive 80% Up Days. Nonetheless, there have been persistent signs of a positive trend in Demand.
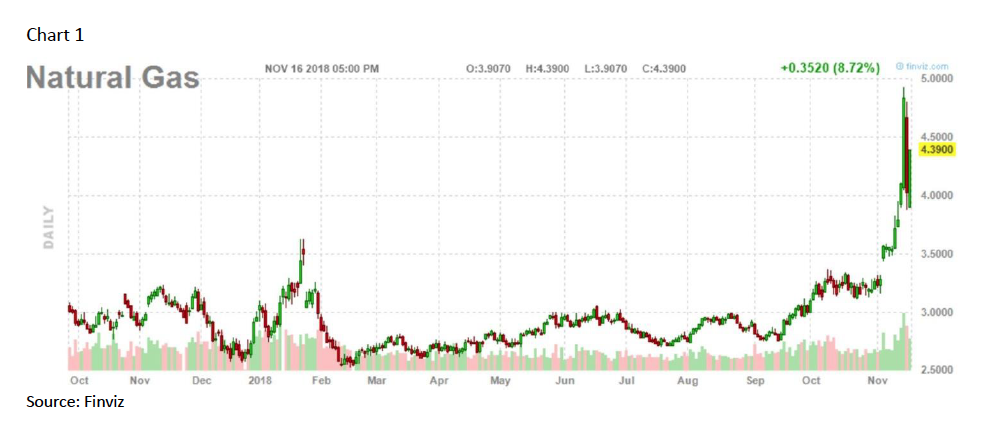
Over the past number of months, we have recommended the midstream Master Limited Partnerships (MLPs) for investment accounts using those MLPs with favorable ratings from our fundamental analysts. Around the late-October lows, we featured buying the D-J Transports using the vehicle of your choice. Before natural gas’s upside explosion, we featured it as a trading opportunity along with Mexico, and, while Mexico has not done much, natural gas certainly has. This morning, we are featuring the S&P Oil & Gas Exploration & Production SPDR (XOP/$34.75) on our sense the downside has been overdone in Rude Crude. That feeling is reflected in the article titled “[The] Selloff in Energy ETFs May Have Gone Too Far” (Crude Sell Off). Further, this headline hit the broad tape on Friday, “Saudis Want to Boost Oil Prices to ~$80/Bbl.”
Also, along a more speculative line, this “trading long” could prove especially valid if these headlines from last Friday ring true:
“Trump: China Sent List of Things Willing to do on Trade”; “Trump: China Would Like to Make a Deal”; “Trump: China List Pretty Complete, Four or Five Things Left Off”.
Moreover, last week, U.S. Trade Representative Robert Lighthizer had said the next round of tariffs on Chinese imports has been put on hold.
Yet, as one Wall Street wag notes:
This year feels really volatile – [however], from peak to trough, the S&P 500 has traded in only a 13.6% range (February lows to September peak) – As of now, this is one of the smallest yearly ranges ever and is half the average year (since ’50) average range of 27.0%. Also, The S&P 500 has changed 1% (up or down) a total of 49 days so far this year. It was only 8 last year – Since ’50, the average per year is 50.
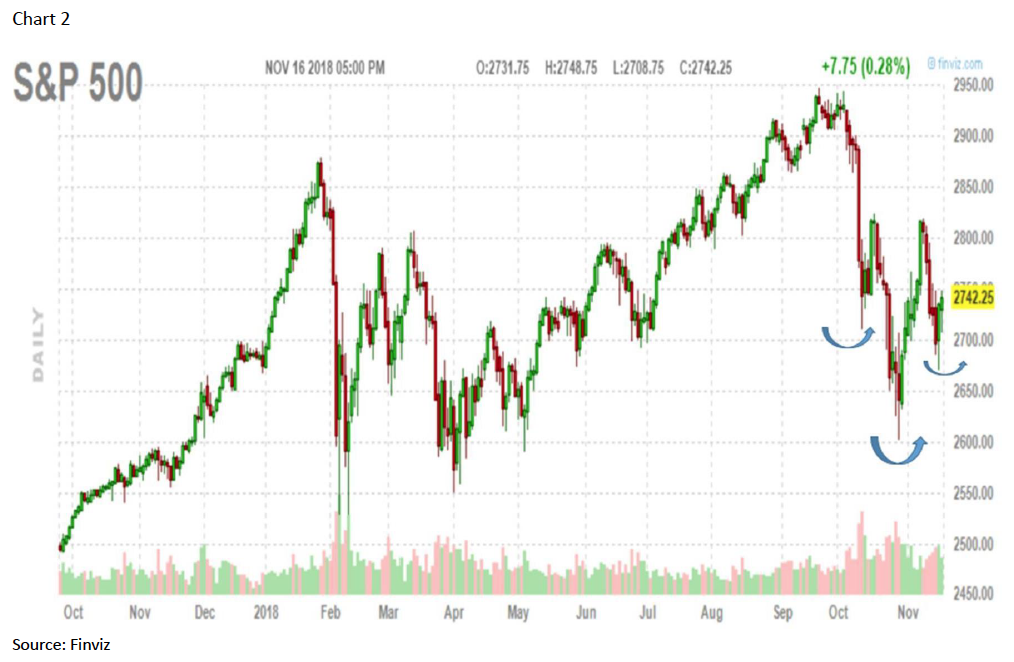
This alleged volatility has left investors not just cautious, but scared to death, which is amazing with the D-J Industrials (INDU/25413.22) only down ~5.3% from the all-time high. Speaking to the Industrials, and the plethora of questions we have received about Dow Theory, by the way we interpret Dow Theory, there has NOT been a Dow Theory “sell signal.” To register such a signal would require a closing price by the Industrials below 23533.20 with a like close by the Transports below 10136.61. And, while the Trannies did indeed break below that level recently, it was totally unconfirmed by the Industrials, which is a downside non-confirmation (read: bullish). We would also note that, while most of the indexes we monitor were down last week, the Transports actually gained 0.63%. The real winner for the week, however, was natural gas, which was up 15.03% (chart 1 below). Meanwhile, the S&P 500 looks to be tracing out a reverse head-and-shoulders bullish chart pattern (chart 2, page 3). And don’t look now, but the 50-day moving average has crossed below the 200-DMA in the Russell 2000 chart. As Lowry’s writes:
All these signs of an improving trend in Demand over the past month are consistent with a market correction and unlike the rapid rise in Supply and decline in Demand that typically occurs during the start of a bear market. There are, however, ongoing signs this bull market is beginning to age, primarily through weakness among small cap stocks.
As for the sectors, the only sectors that have not broken down in the charts are: Healthcare, Real Estate, and Utilities.
The call for this week: Merry Thanksgiving!