


Weekly Market Updates
Investment Strategy: “Painful Ups and Downs”
Speaking of “Painful Ups and Downs,” well not exactly very many “downs” over the past six months until last Thursday’s gotcha. That intraday plunge had many pundits shouting, “one-day downside reversal” – as the S&P 500 (SPX/2472.10) went from +6-points early in the session, to a minus ~17-point S&P 500 dive from 12:35 p.m. into the 1:30 p.m. pivot point – before recovering to close down by a mere ~2-points. The early strength was attributed to the better than expected June Durable Goods report, which jumped 6.5% (+3.9%E) due to a 131.2% surge in civilian aircraft orders. Interestingly, ex-transportation, orders were up 0.2% versus expectations of a +0.4% increase. Drilling down into those numbers caused some participants to cry “oops!” Despite the early morning stock strength, and the strong aircraft orders, Southwest Airlines telegraphed disappointing revenue growth causing the D-J Transports (TRAN/9227.07) to slide. The Transports trouncing accelerated as traders also sold Landstar (-8.47%), Fed Ex (-2.85%), UPS (-4.01%), and the rout was on. The result left the Transports off as much as ~336 points at the session’s lows (or -3.5%) before somewhat recovering into the closing bell (note: the TRAN intraweek low was at 9147.30 with its 200-day moving average residing at 9100.82). Of course, that action caused our email box to light up with oodles of question like, “What are the Transports telling us about the stock market and the economy?” Our response was, “’Absolutely nothing, say it again,’ a phrase from the song in an era gone by (War).” Also adding to the downside drama was this quip from J.P. Morgan’s quantitative analyst Marko Kolanovic, which hit the broad tape around the downside flip at 12:35 p.m. last Thursday:
It is safe to say that volatility has reached all-time lows and this should give pause to equity managers. Low volatility would not be a problem if not for strategies that increase leverage when volatility declines. Many of these strategies (option hedging, volatility targeting, CTAs, risk parity, etc.) share similar features with the dynamic “portfolio insurance” of 1987. While these strategies include concepts like “risk control,” “crisis alpha,” etc. in various degrees they rely on selling into market weakness to cut losses. This creates a “stop loss order” that gets larger in size and closer to the current market price as volatility gets lower.
Completing the day’s “news” trifecta were rumors that Amazon was going to notch a disappointing earnings report after the close. And sure enough, after the “bell,” Amazon reported a 77% decline in earnings ($0.40 vs. $1.42E) causing one Wall Street wag to scream, “Speaking of LEAKS, where is the SEC on this one?!”
Yet a funny thing happened Friday morning, for as I spoke to our financial advisors, and clients here in Vancouver, stocks did not crater, but actually stabilized and then attempted to rally. By the close the major indices were little changed for the trading session. To be sure, that type of action was forecasted by our models in the previous week, and early last week by our models, when we wrote:
Our short-term model continues to telegraph the potential for more downside attempts that don’t gather much traction. Of major interest is that there is the lack of a leap in the Selling Pressure Index, which is declining.
Meanwhile, Buying Power continues to rise and is about to cross above the Selling Pressure Index in the charts (read: bullish). Therefore, in the near-term, if more sellers “show up,” we deem it a BUY, because the upside potential is for dramatically higher prices into 2018.
The call for this week: There have been five downside bursts like last Thursday’s over the past few weeks with only one of them closing near the lows of the session. The other four such bursts saw “buyers” show up leaving the averages little changed on the day. Andrew and I think there is a market message there in that those participants waiting for a large pullback are going to continue to be disappointed. Our work still suggests the equity markets should push higher this week. Moreover, there is a potential sea change at hand, for as the keen-sighted Jason Goepfert (SentimenTrader) writes:
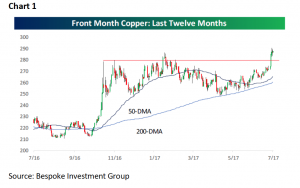
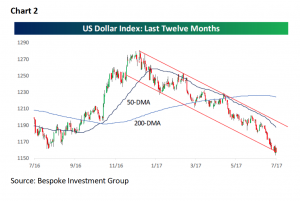
Both stocks and copper futures hit new highs this week [Chart 1], which is widely considered to be a sign of global economic growth, at least according to investors. By no means has it been a slam-dunk sign of future positive returns, but the S&P 500 did see further gains over the next 6-12 months almost without exception. Blame the dollar [because] a weak U.S. dollar is usually good for copper, so it’s not a big surprise that copper is near a 52-week high [Chart 1] while the dollar has sunk to a 52-week low [Chart 2]. The correlation between the dollar and stocks is not nearly as strong. When stocks have been at a high and the dollar at a low, once again the S&P 500 showed a positive return over the next 6-12 months almost without exception.
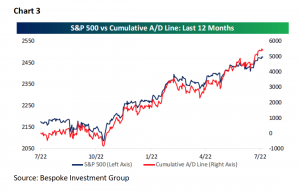
Meanwhile, the Advance/Decline Line continues to point the way higher [Chart 3] and reporting companies continue to beat earnings estimates at a +63.2% “beat rate” for the 2Q17, while revenue beats tag a +63% rate. Indeed, the secular bull market has transitioned to an earnings driven secular bull market from an interest rate driven secular bull market. And that is the way it is as we write at 3:00 a.m. from the West Coast. And the tweet of the weekend from DJT:
I am very disappointed in China. Our foolish past leaders have allowed them to make hundreds of billions of dollars a year in trade, yet . . . they do NOTHING for us with North Korea, just talk. We will no longer allow this to continue. China could easily solve this problem!
Important Investor Disclosures
Raymond James & Associates (RJA) is a FINRA member firm and is responsible for the preparation and distribution of research created in the United States. Raymond James & Associates is located at The Raymond James Financial Center, 880 Carillon Parkway, St. Petersburg, FL 33716, (727) 567-1000. Non-U.S. affiliates, which are not FINRA member firms, include the following entities that are responsible for the creation and distribution of research in their respective areas: in Canada, Raymond James Ltd. (RJL), Suite 2100, 925 West Georgia Street, Vancouver, BC V6C 3L2, (604) 659-8200; in Europe, Raymond James Euro Equities SAS (also trading as Raymond James International), 40, rue La Boetie, 75008, Paris, France, +33 1 45 64 0500, and Raymond James Financial International Ltd., Broadwalk
House, 5 Appold Street, London, England EC2A 2AG, +44 203 798 5600.
This document is not directed to, or intended for distribution to or use by, any person or entity that is a citizen or resident of or located in any locality, state, country, or other jurisdiction where such distribution, publication, availability or use would be contrary to law or regulation. The securities discussed in this document may not be eligible for sale in some jurisdictions. This research is not an offer to sell or the solicitation of an offer to buy any security in any jurisdiction where such an offer or solicitation would be illegal. It does not constitute a personal recommendation or take into account the particular investment objectives, financial situations, or needs of individual clients. Past performance is not a guide to future performance, future returns are not guaranteed, and a loss of original capital may occur. Investors should consider this report as only a single factor in making their investment decision.
For clients in the United States: Any foreign securities discussed in this report are generally not eligible for sale in the U.S. unless they are listed on a U.S. exchange. This report is being provided to you for informational purposes only and does not represent a solicitation for the purchase or sale of a security in any state where such a solicitation would be illegal. Investing in securities of issuers organized outside of the U.S., including ADRs, may entail certain risks. The securities of non-U.S. issuers may not be registered with, nor be subject to the reporting requirements of, the U.S. Securities and Exchange Commission. There may be limited information available on such securities. Investors who have received this report may be prohibited in certain states or other jurisdictions from purchasing the securities mentioned in this report.
Please ask your Financial Advisor for additional details and to determine if a particular security is eligible for purchase in your state.
The information provided is as of the date above and subject to change, and it should not be deemed a recommendation to buy or sell any security. Certain information has been obtained from third-party sources we consider reliable, but we do not guarantee that such information is accurate or complete. Persons within the Raymond James family of companies may have information that is not available to the contributors of the information contained in this publication. Raymond James, including affiliates and employees, may execute transactions in the securities listed in this publication that may not be consistent with the ratings appearing in this publication.
Raymond James (“RJ”) research reports are disseminated and available to RJ’s retail and institutional clients simultaneously via electronic publication to RJ’s internal proprietary websites (RJ Investor Access & RJ Capital Markets). Not all research reports are directly distributed to clients or third-party aggregators. Certain research reports may only be disseminated on RJ’s internal proprietary websites; however such research reports will not contain estimates or changes to earnings forecasts, target price, valuation, or investment or suitability rating. Individual Research Analysts may also opt to circulate published research to one or more clients electronically. This electronic communication distribution is discretionary and is done only after the research has been publically disseminated via RJ’s internal proprietary websites. The level and types of communications provided by Research Analysts to clients may vary depending on various factors including, but not limited to, the client’s individual preference as to the frequency and manner of receiving communications from Research Analysts. For research reports, models, or other data available on a particular security, please contact your RJ Sales Representative or visit RJ Investor Access or RJ Capital Markets.
Additional information is available on request.
Analyst Information
Registration of Non-U.S. Analysts: The analysts listed on the front of this report who are not employees of Raymond James & Associates, Inc., are not registered/qualified as research analysts under FINRA rules, are not associated persons of Raymond James & Associates, Inc., and are not subject to FINRA Rule 2241 restrictions on communications with covered companies, public companies, and trading securities held by a research analyst account.
Analyst Holdings and Compensation: Equity analysts and their staffs at Raymond James are compensated based on a salary and bonus system. Several factors enter into the bonus determination including quality and performance of research product, the analyst’s success in rating stocks versus an industry index, and support effectiveness to trading and the retail and institutional sales forces. Other factors may include but are not limited to: overall ratings from internal (other than investment banking) or external parties and the general productivity and revenue generated in covered stocks.