


Weekly Market Updates
Investment Strategy: “Secular Bull Markets”
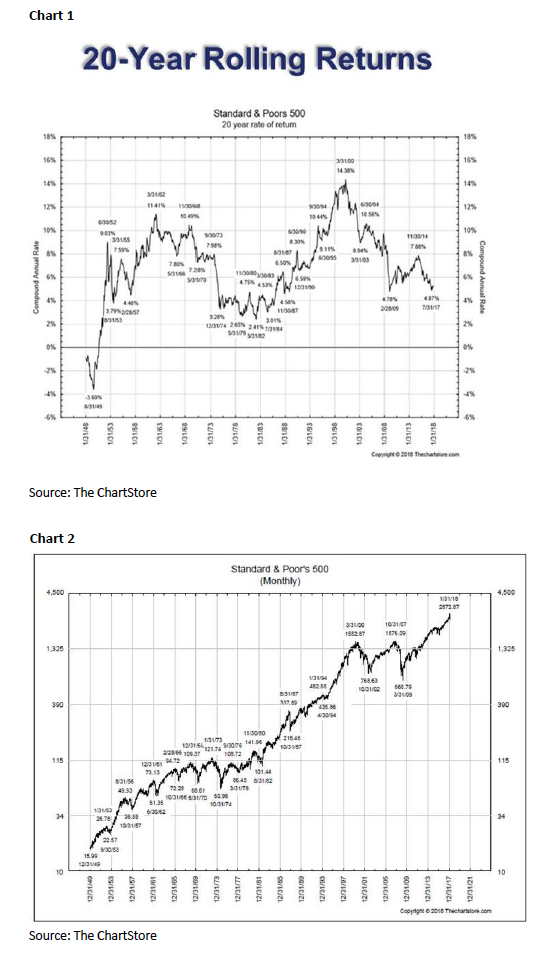
At Raymond James we offer something called a BIO visit. The acronym BIO stands for “by invitation only.” It means that clients can come to our campus in Saint Petersburg and spend a day or two meeting with senior management of this firm, select analysts, portfolio managers, investment bankers, financial planners, me . . . well you get the idea. Over the past few weeks we have done a number of these BIO visits and the ongoing question from the clients has been, “What do you mean when you say ‘secular’ bull market?” It is a valid question because most folks believe a 20% rally, or a 20% decline, represent bull and bear markets. However, that is not what a secular bull market is. Secular bull markets last 14+ years and tend to compound money at a double-digit return per year. The secular bull market of 1949 to 1966 compounded money at 11.41% per years basis the S&P 500. The 1982 to 2000 secular bull market compounded money at 14.38% using a 20-year rolling return (Chart 1). Were there pullbacks in those secular bull markets? You bet there were, but it didn’t stop the secular bull market. And there, ladies and gentlemen, is the most misunderstood point about bull markets. Most pundits cut the 1949 – 1966 Bull Run off in 1956 when the stock market took a ~21% “hit” because Egypt attempted to take over the Suez Canal, but as can be seen in Chart 2 that did not stop the bull market. Fast forward to the 1982 – 2000 secular bull market, which many participants cut off in 1987 due to the crash, but hereto that did not stop the bull market (Chart 2). We think the current secular bull market is going to be bigger than both of those secular bull markets.
It has been said that an investor will experience three secular bull markets in their life time. In the first one you will not have enough money to take advantage of it. In the third one you will be too old to take the amount of risk to really take advantage of it. Therefore, you had better take full advantage of the second bull market. Most baby boomers were not old enough to do anything with the 1949 – 1966 “run.” Moreover, most boomers did not have enough money to take full advantage of the 1982 – 2000 rally, except near the end of that Bull Run. And then most did not heed the Dow Theory “sell signal” that occurred on September 23, 1999, so they gave back much of their late-cycle gains. Consequently, they need to take full advantage of this secular bull market, which we continue to believe has years left to run. And there is yet another much misunderstood point.
Most believe this bull market began on March 9, 2009. However, the majority of stocks made their “lows” on October 10, 2008. At the time we wrote that 92.6% of all stocks traded made new annual lows. Sure, the indices went lower into March 2009, but the majority of stocks bottomed in October 2008. That is where we think the current secular bull market began.
The bottoming sequence was almost classic. We made the “selling climax” low on October 10, 2008 followed by a “throwback rally,” that failed, leading to the undercut low of March 6, 2009, which was below those October 2008 selling- climax lows. As an aside, this was the same bottoming chart pattern that we identified in February 2018 when we said to buy the “undercut low” that occurred on February 9, but we digress. Such bull markets also tend to have three upside “legs” to them. We believe the first leg began in October 2008 and ended in May 2015. The second leg began in February of 2016.
The second leg is ALWAYS the longest and strongest. Once the second leg ends we should experience another upside consolidation like the one between May of 2015 and February 2016. Eventually the indices should resolve out of that consolidation on the upside and begin the third, or speculative, leg of the secular bull market. For example, the third leg of the 1982 – 2000 “run” started in late 1994 and lasted until the spring of 2000. Regrettably, there are not many of us still around that have seen a secular bull market, which is why so many refuse to trust this one. One savvy seer, however, that has seen such Bull Runs is our friend Leon Tuey, who is one of the best technical analysts on Wall Street. Recently (March 6, 2018) Leon wrote a report titled “Endless Worries.” To wit:
One of the key features of this great bull market is investor sentiment. October 10, 2018 will be the 10th anniversary of this great bull market. Yet, from its beginning to date, investors are burdened by worries, even when there is nothing to worry about. Global depression, China’s huge debt and empty cities, the European Debt Crisis, the Arab Spring, the Japanese Tsunami and nuclear plant meltdown, Capitol Hill gridlock, the U.S. election were some of the concerns that troubled investors. More recently, they worry about inflation, Fed tightening, and trade wars. They worry endlessly. Not surprisingly, the market always climbs a wall of worry.
In early February, fear was widespread and globally, investors panicked. Consequently, I concluded that peak selling intensity was witnessed and the market had entered a low-risk, high-reward juncture point and felt the after period of base-building, that the bull market would resume. Moreover, investors were advised to emphasize stock selection rather than worrying about the S&P 500. If you are worried, you are among the majority. Last Friday, the CNN Fear & Greed Index stood at 8, indicating extreme fear. Also, the Barron’s Insider Transaction Ratio dropped to 9. Readings below 12.1 are bullish. Moreover, last week, the AAII Sentiment Survey showed that the Bullish percent dropped to 37.3%. Furthermore, in the week of February 5, the ratio of VXV-to-VIX dropped to the lowest level on record. Also, it is interesting to note that in February, the TD Ameritrade Index registered its biggest monthly-drop ever; small investors bolted for the exit. Gripped by fear, investors panicked. Clearly, sentiment backdrop is ideal. Remember what Warren Buffett said – “Be fearful when others are greedy and be greedy when others fearful.”
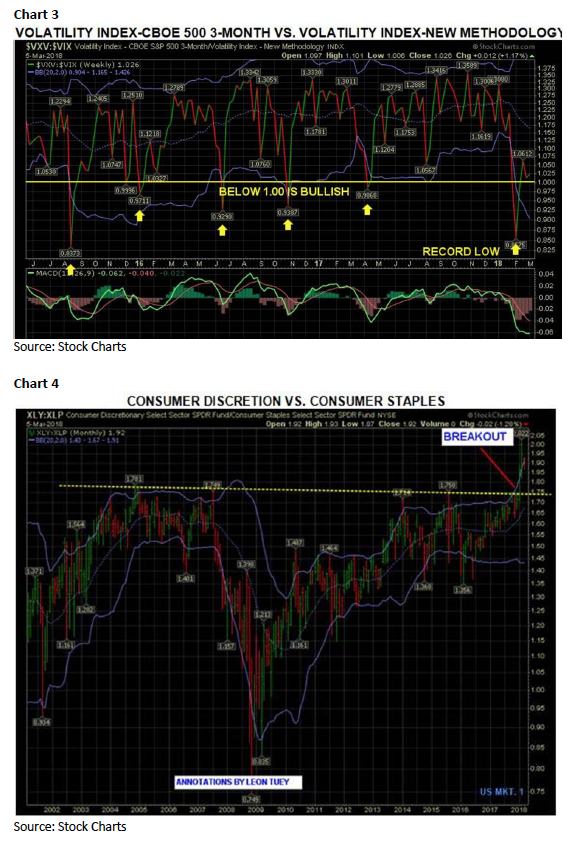
Those who are worried about the economy, don’t fret. Take a gander at the chart [Chart 4] showing the Consumer Discretionary vs. Consumer Staples. In February, this ratio hit another record high. More importantly, it broke out of a 12-year base. The breakout suggests that in the years ahead, consumer discretionary stocks will continue to outperform Consumer Staples issues, which suggests the economy will continue to improve. Therefore, the upside breakout by this ratio has bullish implications for the economy and the stock market. Accordingly, stop worrying already!
The call for this week: The S&P 500 (SPX/2786.57) has traveled back to its February 27, 2018 intraday high of 2789.15, which was where our short-term model “said” would be a near-term top a few weeks ago. At the time the stock market’s internal energy was totally used-up and needed to be rebuilt. That is not the case currently. The market’s energy now has a full charge and both the short and intermediate-term models suggest the SPX should blow through the February 27 intraday high. If that happens there is a good chance we will break out to new all-time highs. Reinforcing that sense was this email sent to me over the weekend from Leon Tuey:
Good morning, Jeffrey. I just called your office, but I didn’t think you would be working. Many are waiting for the market to bottom or a “test” not realizing the market bottomed in early February when the whole world panicked and the great bull market had resumed. Last week, the Advance-Declines [lines] for the S&P, Dow, NDX, S&P Mid-Cap, and S&P Small-Cap closed at record highs. Clearly, recent events show that investors are still haunted by the bear market of 2007-2009. Their optimism in early January was only skin-deep as optimism turned to fear almost overnight. I’ve noticed that many of the low-price biotech and high-tech issues have traced out huge bases. What that tells me is it’s a set up for a massive speculative binge at the end of this [secular] bull market. A few years ago, I told many brokers that when this bull market ends, investors will witness the greatest upside “blow-off” on record.
Like Andrew and I have repeatedly said, “No retest of the February lows!”
Important Investor Disclosures
Raymond James & Associates (RJA) is a FINRA member firm and is responsible for the preparation and distribution of research created in the United States. Raymond James & Associates is located at The Raymond James Financial Center, 880 Carillon Parkway, St. Petersburg, FL 33716, (727) 567-1000. Non-U.S. affiliates, which are not FINRA member firms, include the following entities that are responsible for the creation and distribution of research in their respective areas: in Canada, Raymond James Ltd. (RJL), Suite 2100, 925 West Georgia Street, Vancouver, BC V6C 3L2, (604) 659-8200; in Europe, Raymond James Euro Equities SAS (also trading as Raymond James International), 40, rue La Boetie, 75008, Paris, France, +33 1 45 64 0500, and Raymond James Financial International Ltd., Broadwalk House, 5 Appold Street, London, England EC2A 2AG, +44 203 798 5600.
This document is not directed to, or intended for distribution to or use by, any person or entity that is a citizen or resident of or located in any locality, state, country, or other jurisdiction where such distribution, publication, availability or use would be contrary to law or regulation. The securities discussed in this document may not be eligible for sale in some jurisdictions. This research is not an offer to sell or the solicitation of an offer to buy any security in any jurisdiction where such an offer or solicitation would be illegal. It does not constitute a personal recommendation or take into account the particular investment objectives, financial situations, or needs of individual clients. Past performance is not a guide to future performance, future returns are not guaranteed, and a loss of original capital may occur. Investors should consider this report as only a single factor in making their investment decision.
For clients in the United States: Any foreign securities discussed in this report are generally not eligible for sale in the U.S. unless they are listed on a U.S. exchange. This report is being provided to you for informational purposes only and does not represent a solicitation for the purchase or sale of a security in any state where such a solicitation would be illegal. Investing in securities of issuers organized outside of the U.S., including ADRs, may entail certain risks. The securities of non-U.S. issuers may not be registered with, nor be subject to the reporting requirements of, the U.S. Securities and Exchange Commission. There may be limited information available on such securities. Investors who have received this report may be prohibited in certain states or other jurisdictions from purchasing the securities mentioned in this report.
Please ask your Financial Advisor for additional details and to determine if a particular security is eligible for purchase in your state.
The information provided is as of the date above and subject to change, and it should not be deemed a recommendation to buy or sell any security. Certain information has been obtained from third-party sources we consider reliable, but we do not guarantee that such information is accurate or complete. Persons within the Raymond James family of companies may have information that is not available to the contributors of the information contained in this publication. Raymond James, including affiliates and employees, may execute transactions in the securities listed in this publication that may not be consistent with the ratings appearing in this publication.
Raymond James (“RJ”) research reports are disseminated and available to RJ’s retail and institutional clients simultaneously via electronic publication to RJ’s internal proprietary websites (RJ Investor Access & RJ Capital Markets). Not all research reports are directly distributed to clients or third-party aggregators. Certain research reports may only be disseminated on RJ’s internal proprietary websites; however such research reports will not contain estimates or changes to earnings forecasts, target price, valuation, or investment or suitability rating. Individual Research Analysts may also opt to circulate published research to one or more clients electronically. This electronic communication distribution is discretionary and is done only after the research has been publically disseminated via RJ’s internal proprietary websites. The level and types of communications provided by Research Analysts to clients may vary depending on various factors including, but not limited to, the client’s individual preference as to the frequency and manner of receiving communications from Research Analysts. For research reports, models, or other data available on a particular security, please contact your RJ Sales Representative or visit RJ Investor Access or RJ Capital Markets.
Links to third-party websites are being provided for information purposes only. Raymond James is not affiliated with and does not endorse, authorize, or sponsor any of the listed websites or their respective sponsors. Raymond James is not responsible for the content of any third-party website or the collection or use of information regarding any website’s users and/or members.
Additional information is available on request.