


Weekly Market Updates
Investment Strategy: The Curve
It is espoused that the flattening yield curve is telegraphing the potential of a recession in the not too distant future. As reflected in Barron’s a week ago:
Who’s afraid of a flat yield curve? The typical investor is – in the same way a vampire dreads a cross. When the market flashes a flat yield curve, investors instinctively raise their hands in defense, expecting an inverted curve to follow.
There’s a reason for this emotional response: Each of the past seven recessions has been preceded by an inverted yield curve. With the curve – the spread between the two-year and 10-year Treasuries – flattening as of late, there’s growing nervousness about an inverted yield curve next year and a recession thereafter.
Yet, as Jones Trading’s David Lutz writes:
Richard Turnill, global chief investment strategist at BlackRock said last month that “the flatter curve is not a recessionary signal” – He noted that the flattening has been due to rising two-year yields in response to expectations for the Fed rate to rise. “This shows greater market confidence in the Fed nudging up rates mainly due to the better growth and inflation outlook,” he said. Mr. Turnill added that strong demand for longer-term debt issues has also been pressuring the long end of the curve.
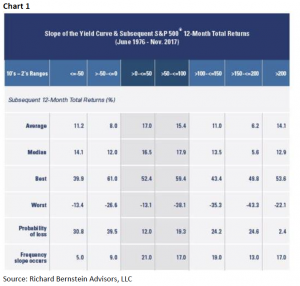
Of interest is that investors tend to not pay much attention to the yield curve when it is steep, but let it flatten, and they pay WAY too much attention to it despite the fact that a flattened curve historically has been a pretty good occurrence for equities. As Rich Bernstein, of Richard Bernstein Advisors (RBA), writes:
[Chart 1] shows historical expected returns and probabilities of a negative return for varying ranges of yield curve slopes. Note that the stock market’s expected return was about 17%, [and] the expected return was negative only 12% of the time, and the 12-month potential drawdown was the shallowest when the spread between the 10-year and 2-year t-notes was between 0 and 50 bps.
Accordingly, we are not all that concerned with the shape of the yield curve.
As for the equity markets, we found this quip from Tom Bowley, of StockCharts.com’s Trading Places with Tom Bowley, to be very insightful:
Here’s another new year’s resolution. Always follow the trend until there’s no more trend. I’ve heard countless times since the 2009 bottom that the bull market ended. Really? Take a look at the S&P 500 chart [Chart 2 on page 3]. Are we in a bull market? Seriously, is this even a question that needs answering? Whether you understand the reasons for it, the stock market is absolutely on fire and sitting back and waiting for the next bear market is not a great strategy when prices are rising without pause. I noted the last two periods when the S&P 500 index moved back above its 20 month EMA (periods between the green vertical lines). Note that we had a 4 1/2 year period from mid-2003 to the end of 2007 without an S&P 500 monthly close beneath its 20 month EMA. From late-2011 through mid-2015 we saw the same thing – nearly a 4 year period without a 20 month EMA failure. We began our last such move above the 20 month EMA in early-2016 so we’ve yet to trade two years above this 20 month EMA. Is this latest move higher just beginning? I could argue that it is. Obviously, the best long-term entry point into this bull market would be after a 10% correction where the S&P 500 would trade much closer to its 20 month EMA, but how long will that take? Can you afford not to invest in one of the best bull markets of our time?
It was our friend Rich Bernstein who, back in 2009, told us, “This is going to be the biggest bull market of my career!” Rich is the former institutional all-star strategist at Merrill Lynch and is one of the best “thinkers” on Wall Street. We agreed with Rich in 2009 and have not waivered on the secular bull market “call” since the bottoming process began in October 2008. In past missives, we have suggested investors will experience three secular bull markets in their lifetimes. In the first, they will not have enough money to take much advantage of it. In the third one, they will be too old to take the risk. So, they had better take advantage of the one in the middle (like this one) to accumulate wealth.
Speaking of bull markets, over the past few months, we have suggested there is the potential for another secular bull market in “stuff stocks.” Recall, when China joined the World Trade Organization (WTO) in December 2001, we deduced that Chinese per capita income was going to go up and that would cause the consumption of more “stuff” (commodities). It was a very profitable theme. We stepped off that theme with the Dow Theory “sell signal” on November 21, 2007, when we wanted to raise cash and have not really embraced that theme again until recently.
Again, as Rich points out:
One of RBA’s primary investment tenets is that return on capital is highest when capital is scarce. In other words, it is more profitable to be the one banker in a town of 1,000 borrowers than it is to be one of 1,000 bankers in a town of one borrower. Simple [put] supply and demand for capital tends to set prospective investment returns. . . . However, it is difficult today to find segments of the global financial markets that are starved for capital because of the abundance of liquidity. However, we have found success in our portfolios by searching for market segments in which capital is relatively scarcer if not scarce. It’s hard to argue that bonds are starved for capital when nearly a half-trillion dollars has flowed into bond funds and ETFs. However, only about 1/100th of that amount has flowed into commodity funds and ETFs during the period. This is one reason RBA’s portfolios have been overweight materials, gold miners, and gold, and why the fixed-income weights in our multi-asset portfolios have been close to their minimum allowed levels.
We continue to tilt portfolios accordingly.
The call for this week: It’s been said, “So goes the first week of the New Year, so goes the month and so goes the year.” If that’s the case, we are in for somewhat of a repeat of 2017 as often written in these reports. Indeed, we’ve seen four trading sessions in 2018 and four new all-time highs with the D-J Industrials and the D-J Transports both tagging new all-time highs. That, ladies and gents, is yet another reconfirmation of a string of Dow Theory “buy signals.” Importantly, the Advance/Decline Line also registered new highs.

Important Investor Disclosures
Raymond James & Associates (RJA) is a FINRA member firm and is responsible for the preparation and distribution of research created in the United States. Raymond James & Associates is located at The Raymond James Financial Center, 880 Carillon Parkway, St. Petersburg, FL 33716, (727) 567-1000. Non-U.S. affiliates, which are not FINRA member firms, include the following entities that are responsible for the creation and distribution of research in their respective areas: in Canada, Raymond James Ltd. (RJL), Suite 2100, 925 West Georgia Street, Vancouver, BC V6C 3L2, (604) 659-8200; in Europe, Raymond James Euro Equities SAS (also trading as Raymond James International), 40, rue La Boetie, 75008, Paris, France, +33 1 45 64 0500, and Raymond James Financial International Ltd., Broadwalk House, 5 Appold Street, London, England EC2A 2AG, +44 203 798 5600.
This document is not directed to, or intended for distribution to or use by, any person or entity that is a citizen or resident of or located in any locality, state, country, or other jurisdiction where such distribution, publication, availability or use would be contrary to law or regulation. The securities discussed in this document may not be eligible for sale in some jurisdictions. This research is not an offer to sell or the solicitation of an offer to buy any security in any jurisdiction where such an offer or solicitation would be illegal. It does not constitute a personal recommendation or take into account the particular investment objectives, financial situations, or needs of individual clients. Past performance is not a guide to future performance, future returns are not guaranteed, and a loss of original capital may occur. Investors should consider this report as only a single factor in making their investment decision.
For clients in the United States: Any foreign securities discussed in this report are generally not eligible for sale in the U.S. unless they are listed on a U.S. exchange. This report is being provided to you for informational purposes only and does not represent a solicitation for the purchase or sale of a security in any state where such a solicitation would be illegal. Investing in securities of issuers organized outside of the U.S., including ADRs, may entail certain risks. The securities of non-U.S. issuers may not be registered with, nor be subject to the reporting requirements of, the U.S. Securities and Exchange Commission. There may be limited information available on such securities. Investors who have received this report may be prohibited in certain states or other jurisdictions from purchasing the securities mentioned in this report.
Please ask your Financial Advisor for additional details and to determine if a particular security is eligible for purchase in your state.
The information provided is as of the date above and subject to change, and it should not be deemed a recommendation to buy or sell any security. Certain information has been obtained from third-party sources we consider reliable, but we do not guarantee that such information is accurate or complete. Persons within the Raymond James family of companies may have information that is not available to the contributors of the information contained in this publication. Raymond James, including affiliates and employees, may execute transactions in the securities listed in this publication that may not be consistent with the ratings appearing in this publication.
Raymond James (“RJ”) research reports are disseminated and available to RJ’s retail and institutional clients simultaneously via electronic publication to RJ’s internal proprietary websites (RJ Investor Access & RJ Capital Markets). Not all research reports are directly distributed to clients or third-party aggregators. Certain research reports may only be disseminated on RJ’s internal proprietary websites; however such research reports will not contain estimates or changes to earnings forecasts, target price, valuation, or investment or suitability rating. Individual Research Analysts may also opt to circulate published research to one or more clients electronically. This electronic communication distribution is discretionary and is done only after the research has been publically disseminated via RJ’s internal proprietary websites. The level and types of communications provided by Research Analysts to clients may vary depending on various factors including, but not limited to, the client’s individual preference as to the frequency and manner of receiving communications from Research Analysts. For research reports, models, or other data available on a particular security, please contact your RJ Sales Representative or visit RJ Investor Access or RJ Capital Markets.
Links to third-party websites are being provided for information purposes only. Raymond James is not affiliated with and does not endorse, authorize, or sponsor any of the listed websites or their respective sponsors. Raymond James is not responsible for the content of any third-party website or the collection or use of information regarding any website’s users and/or members.
Additional information is available on request.