Investment Strategy: “Trading Sardines?!”
One of the attendees was Linda Bradford Raschke, a professional trader, who used to trade on the Pacific and Philadelphia Stock Exchanges, founded a number of hedge funds, well you get the idea. She has written a book, which she signed and gave to me, titled Trading Sardines, with the byline “Lessons in the markets from a lifelong trader.” I asked her if she knew where the term “trading sardines” came from and she responded, “No, but I have heard it all my adult life.” Subsequently, I told her the real story:
“While gold was first discovered in Alaska during the 1870s, the 1890s have come to be known as the Yukon-Klondike Gold Rush days, as thousands of rugged individuals swarmed to the northern climes to find fortune and glory. Unsurprisingly, during the winter of 1896-97 the Alaskan ports were frozen solid and therefore closed to all shipping traffic. Food became very scarce and very expensive since new supplies had to be brought in over land at great hardship. Reportedly, a can of sardines that had cost $0.10 in New York could be priced at 10 times that amount by the time it reached the gold miners in Alaska. Still, there was great demand even at such inflated prices. For instance, in one remote mining town the price of a can of sardines was sold at rapidly escalating prices from $10.00, to $30.00, then $50.00. Finally, one desperately hungry miner paid $100.00 for a can of the highly sought after sardines. He took it back to his room to eat. He opened it. To his amazement he discovered the sardines were rotten. Angered, he found the person who sold him the tin and confronted him with the rotten evidence. The seller was amazed and shouted, ‘You mean you actually opened that can of sardines? You fool; those were trading sardines, NOT eating sardines!’”
… Anonymous
Last week, however, nobody was talking about trading sardines, but rather the slowing economy and the yield curve. Those worries came to a zenith on Friday with the slowing global growth data and the alleged inversion of the yield curve. The Eurozone Markit PMI Manufacturing Index for March came in worse than expected at 47.6 versus the estimate of 49.5, which was lower than the previous month’s 49.3. That’s the fastest contraction in six years. Speaking to the yield curve, all the talking heads are looking at the wrong yield curve; they talk about the 2- to 5-year T’notes, the 2- to 10-year T’notes, and last Friday it was the inversion of the 3-month T’bill to the 10-year T’note. These are NOT the right yield curves. I have had extensive conversations with Ned Davis (Ned Davis Research) about this and the REAL yield curve is/was/and will always be the 3-month T’bill to the 30-year T’bond and it is nowhere near inversion. So anyone that tells you the yield curve has inverted has no concept of history. So much for myth number one about inversion. As the good folks at Bespoke write:
“When investors hear yield curve inversion, they automatically think ‘recession.’ That’s because every recession since 1962 has been preceded by an inversion. But, not every inversion has been followed by a recession, so keep that in mind.”
Myth number two is that we are into the late part of the business cycle. If that is true why are the late cycle stocks acting so poorly? I have argued that the economic downturn was so severe, and the recovery so muted, that what we have done is elongate the mid-cycle. This implies there is much more time until the mid-cycle ends and the late cycle begins.
Myth number three has it that earnings are going to fall off a cliff. I do not believe it. Certainly earnings momentum has slowed, but earnings continue to look pretty good to me. And, if the earnings estimates for the S&P 500 are anywhere near the mark, the SPX is trading at 16.3x this year’s earnings and 15.5x the 2020 estimate. I think with 2Q19 earnings myth number three will evaporate.
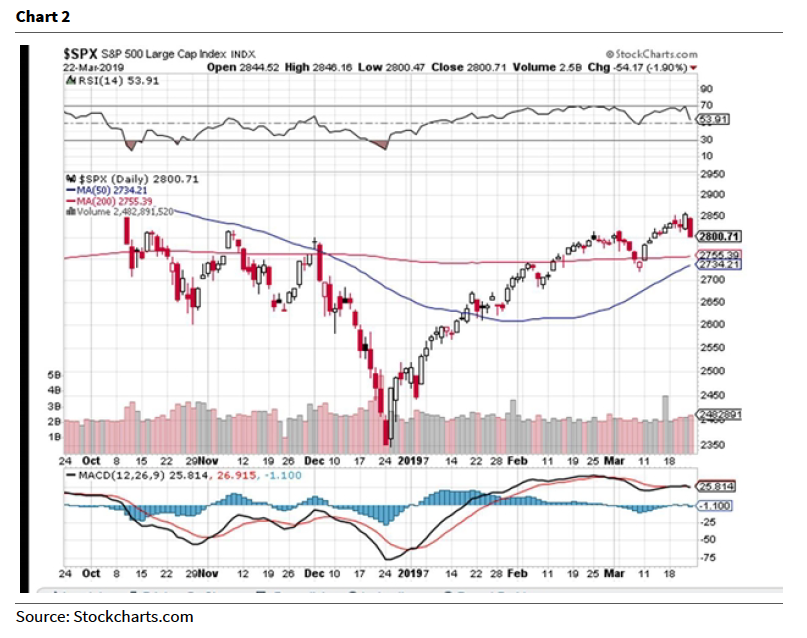
As for Friday’s stock market action, readers of these missives should have found last week’s action as no surprise. I have talked about the negative “polarity flip” that was due to arrive last week for a few weeks. How deep the pullback/pause will be is unknowable, but I have stated I do not think it will be much. It was not only the economic data, and PMIs, that sacked stocks, but as I have repeatedly stated it was also the Mueller Report. The result left the senior index lower by ~460 points and the S&P 500 (SPX/2800.71) resting at the lower end of my support zone of 2800 – 2830.
Speaking to Friday’s Fade, the brainy Lowry’s Research Organization writes:
“In summary, while noting that short-term pullbacks, like breathing in and breathing out, are a normal part of a bull market, our objective analysis of the forces of Supply and Demand continues to indicate a healthy bull market. Consequently, given current market conditions, investors should regard any near-term pullback as simply another opportunity for new buying.”
Plainly, I agree. I say this because there is not much time left in this negative energy polarity flip with the internal energy flow expected to resume positively this week. I think Friday’s drop is about to fuel a bottom and a polarity flip back to a positive position this week. What continues to amaze me is that participants continue to listen to pundits that NEVER saw the October 2018 to December collapse coming, nor did they see last week’s negative “polarity flip.” As our pal Leon Tuey writes:
“Today, the gumflappers are running around like headless chickens screaming: ‘Bond Market Flashes Possible Recession Signal!’ As always, they react and they don’t anticipate. They always know better than the Fed. Also, they always know the ‘problem,’ but never the answer. Moreover, they never seem to understand why God gave us two ears and one mouth. They didn’t hear what Jerome Powell said last year and what he just said this week, too busy displaying their brilliance.”
“If a recession is coming, why are [the consumer discretionary, real estate, and utilities indices] and the A-D Lines acting so well as they usually peak 3 – 6 months before the major market averages? Why are commodities acting so well? Do they know that the stock market is a leading economic indicator? If the Fed cuts rates this year, what will happen to the alleged ‘inverted yield curve’? Do these folks know the Fed’s key statutory mandate which is ‘to maintain orderly economic growth and price stability?'”
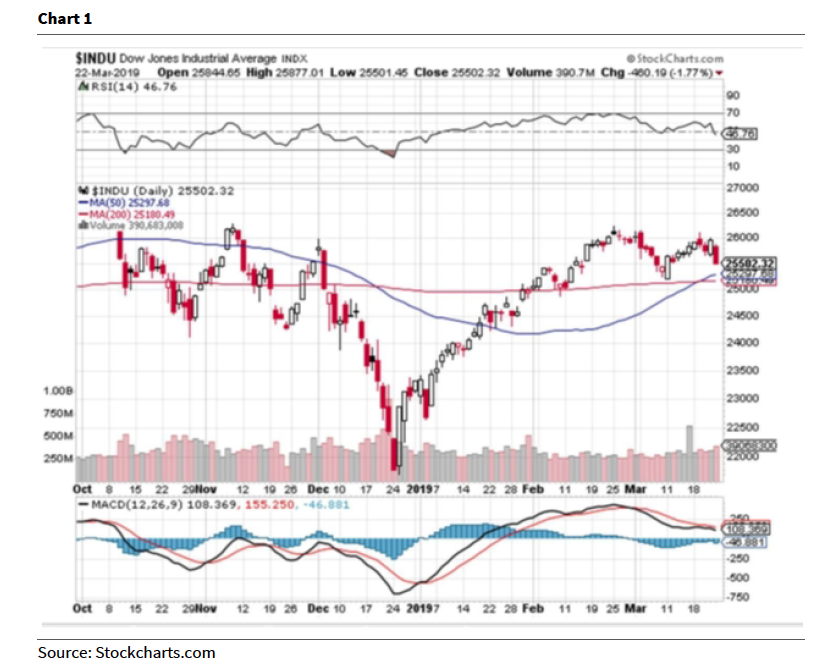
The call for this week: Last week we got a bullish “golden cross” for the D-J Industrial Average (INDU/25502.32) when the Industrial’s 50-day moving average (DMA) crossed above the 200-DMA (chart 1 on page 3). So far the SPX has not seen a similar “golden cross,” but it is very close to also occurring (chart 2 on page 4).
Traders will try to ascertain if the devastating equity plunge on Friday was a one-day or short-term event or if fear of economic contraction is producing real sellers who are overwhelming traders. SPX futures opened +7.50 on Sunday night on the usual pre-Monday buying and DJT’s clearance. As we write, SPX futures are off 6 points because the negative China, Theresa May, and economic news is far more salient. The S&P 500 Index hit a low of 2802.13 on Friday. We have noted several times over the past few weeks that 2800 is important support. Any breach of this area will be troublesome for stocks.


