Weekly Market Updates
Investment Strategy: “Who Do You Trust?”
Three married couples competed on each show; the announcer would introduce couples one at a time, and Carson spent more time interviewing the contestants than quizzing them. In the quiz portion, Carson would tell the male contestant the category of the upcoming question; the contestant would then have to decide whether to answer the question himself or “trust” the female contestant.
We revisit this “Who do you trust” meme this morning because of what I have been saying the past few weeks. After identifying the selling climax low of December 24, when 48.5% of stocks made new lows, I recorded two 90% upside days (90% of volume and upticks came on the upside). The first one occurred on December 26 and the second on January 3. When such a sequence happens within a two-week period from a selling climax low, it is almost always suggestive that the lows are “in.” That is why I have been adamant since January 4 that the December lows (SPX @ 2346) would not be retested like so many pundits were expecting. I have also opined that my work showed that the equity markets should trade higher into the mid-February “energy peak.” However, recently I have stated that, due to the extreme near-term overbought condition of the stock market, I do not “trust” the rally. Indeed, who do you trust?
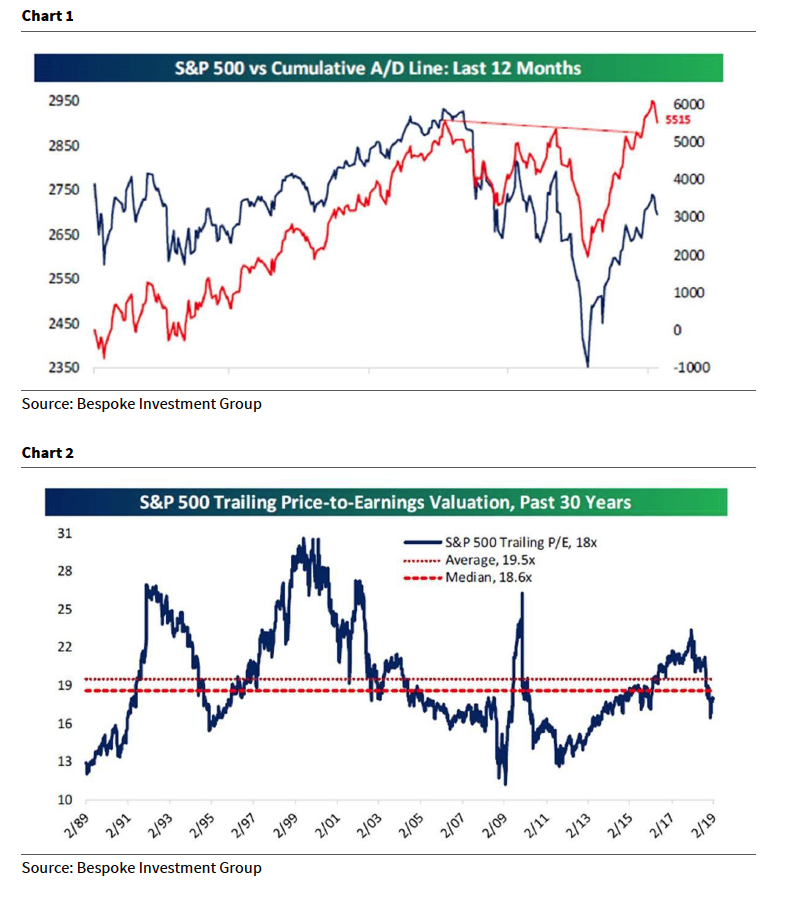
Last week’s late decline came as the S&P 500 (SPX/2707.88) tagged its 200-day moving average (DMA), which now resides at 2742.63. Likewise, the Advance – Decline has peaked and has pulled back (chart 1, page 2). The rally by the SPX off of the December lows encompassed ~16.7% in one of the best “straight up” moves seen in a long time. So far, no damage has been done to the short-term uptrend from the Christmas Eve lows. That said, there were some noticeable divergences with the Industrials, Technology, Staples, and Utilities rallying while Financials, Energy, and Materials fell. That action caused our pal, Leon Tuey, to write:
“A short-term correction has commenced and will likely last 2 – 4 weeks which will prove to be rotational/time in nature and not of magnitude. The consolidation/correction will be global as all daily indicators are registering grossly overbought readings and short-term sentiment backdrop has deteriorated (a sharp rise in bullish sentiment). Moreover, even a few of the weekly indicators are registering overbought readings. After a brief correction, the market will rally to new highs, but the weekly oscillators will unlikely exceed their recent highs. It’s not the end of the world as the secular bull market which began on October 10, 2008, remains intact. As mentioned, the second leg of the bull market which commenced in February, 2016, is the longest and strongest as it is driven by improving economic conditions as a result of monetary easing. Since the first leg lasted nearly seven years, the current leg is still early and still has some ways to go in terms of time and distance. Hence, when the short-term overbought condition is rectified, re-deploy cash.”
Plainly, I agree, believing the secular bull market has years left to run. Yet, a near-term pullback may just be in the cards given the overbought condition of the stock market and the aforementioned divergences. Surprisingly, however, my indicators continue to favor the upside despite the potential for the mid-February “energy peak.” This action is a pretty rare occurrence and is a head scratcher. Accordingly, this week’s market action will be an important “tell” about the short-term direction for stocks.
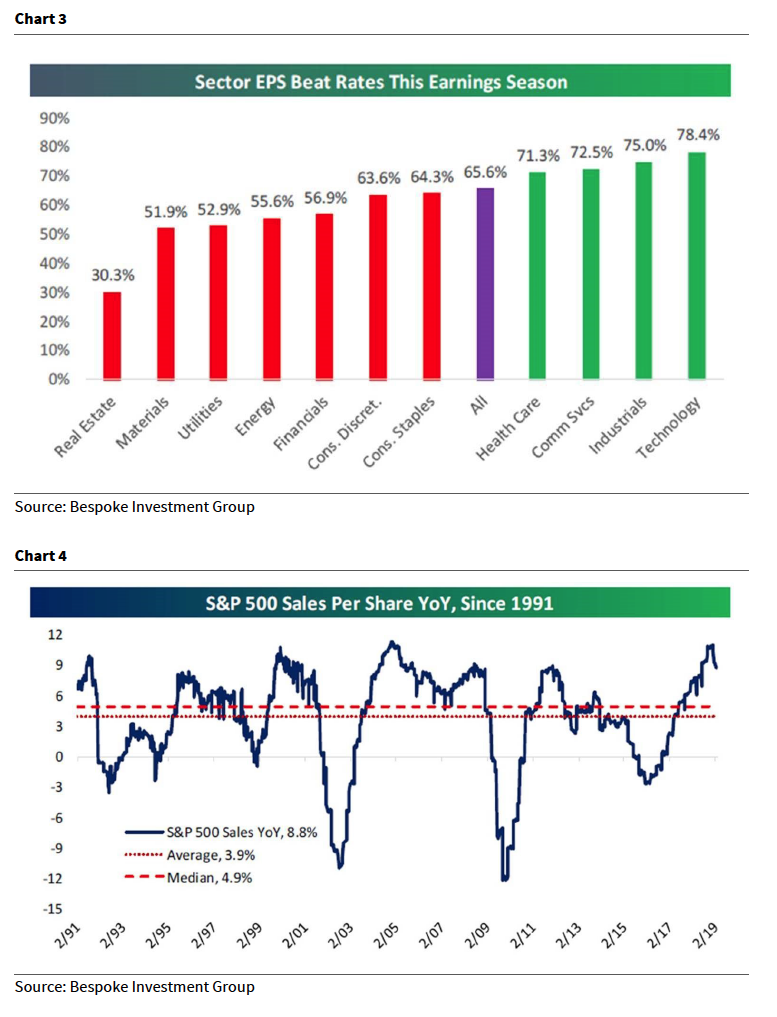
Speaking to valuations, the SPX now trades at a trailing P/E of 18x versus and average of 19.5x. We would note that, at the December lows, if the consensus earnings estimates are right, the SPX was trading at less than 14x forward earnings (chart 2, page 2). While the earning’s growth rate has likely peaked, EPS are still relatively decent. Indeed, so far in the 4Q18 earnings releases, 65.6% of reporting companies have beaten the estimates and 59.6% have better revenue estimates. As for sectors beat rate, Technology, Industrials, Communication Services, and Healthcare were the best (chart 3, page 3). Also, sales growth remains impressive and is rising at the fastest year-over-year clip since the data began to be collected (chart 4, page 3).
During every earnings season, we try to list a few companies that have beaten their earnings and revenue estimates, raised forward earnings guidance, have positive ratings from our fundamental analysts, and screen well by my indicators. Such names from this earnings season for your consideration include: Mix Telematics (MIXT/$17.33/Strong Buy), Estee Lauder (EL/$154.71/Outperform), Harris (HRS/$160.16/Outperform), Mohawk (MHK/$135.78/Outperform), and New Relic (NEWR/$103.21/Outperform).
The call for this week: I spoke at a number of events last week, and I found that the individual investors are not just cautious, they are scared. The two most voiced concerns are that this is just a rally in a bear market and the stock market has rallied too far too fast. Coincidentally, the astute Lowry’s Research Organization commented on those points over the weekend. To wit:
“According to the Lowry Analysis of the forces of Supply and Demand, the probabilities are extremely low that the advance from the Dec. 24th 2018 bottom is a rally in a bear market. In fact, since 1940, no bear market rally has shared the signs of strength exhibited by the advance over the past seven weeks. Rather, these signs of strength, as detailed in prior reports, have been exhibited only in the early phases of major market rallies, specifically rallies off the 1982 and 2009 bear market lows and in Jan. 1987 followed by a 39% gain in the S&P 500 to the Aug. 1987 high.”
As for too far too fast, in our notes of some 55 years, that is just nonsense. This week is kiss and tell time as we enter the mid-February “energy peak” as the SPX stalled at its 200-DMA Maginot Line. Surprisingly, my indicators continue to favor the upside despite the “energy peak.” This morning, the preopening S&P 500 futures are better by 9 points as China is upbeat on trade talk news. The combination of critical China-US trade negotiations and expiry week makes for an extremely combustible stock market. Of course, the question is: In which direction? Headlines, rumors, and whispers about the trade negotiations should impact trading. It could be a wild week!