Weekly Market Updates
Military Preparedness
We think the recent weakness in the defense sector stocks provides an interesting entry spot for investors. Indeed, many of the defense stocks have collapsed since their mid-April all-time highs. Concurrently, the iShares U.S. Aerospace & Defense ETF (ITA/$198.47) has pulled back. Believe it or not, the defense stocks are not just, well defense stocks, but technology stocks, as well. Take Lockheed Martin’s secretive Skunk Works division. As Wikipedia writes:
Skunk Works is an official pseudonym for Lockheed Martin’s Advanced Development Programs (ADP). It is responsible for a number of famous aircraft designs, including the U-2, the Lockheed SR-71 Blackbird, the Lockheed F-117 Nighthawk, Lockheed Martin F-22 Raptor, and the Lockheed Martin F-35 Lightning II, which are used in the air forces of several countries. The designation “skunk works” is widely used in business, engineering, and technical fields to describe a group within an organization given a high degree of autonomy and unhampered by bureaucracy, with the task of working on advanced or secret projects.
Pretty much for this entire nine-year bull market, we have favored Technology and considered the defense stocks to be technology stocks “in drag” with many of them selling at cheaper valuation metrics than the best known tech stocks. The other sector we have really liked is the Financial sector. To that point, we recently met with Anton Schutz, the portfolio manager of the RMB Mendon Financial Services Fund (RMBKX/$46.70). We met him at the Ocean Reef Club near the top of the Florida Keys. After spending a few days with him, and swapping stock ideas, we became very impressed with his investment model. His fund seeks capital appreciation and pursues that goal by investing at least 80% of net assets in the common stocks of U.S. companies in the financial services sector, but primarily in small capitalization stocks (an under-owned space). Anton invests in companies with strong management teams, sound financial practices, and a defensible business niche. His focus is on firms with sustainable growth in earnings and revenue and strong cash flows and in identifying undervalued equities that are temporarily distressed and, therefore, have merger and acquisition potential. As a sidebar, Anton is friends with our pal David Ellison who manages the Hennessy Small Cap Financial Fund (HSFNX/$24.99), which I own. In the current market cycle, we like the “small-cap” space for numerous reasons and would note that the S&P Small Cap 600 traded to new all-time highs last week.
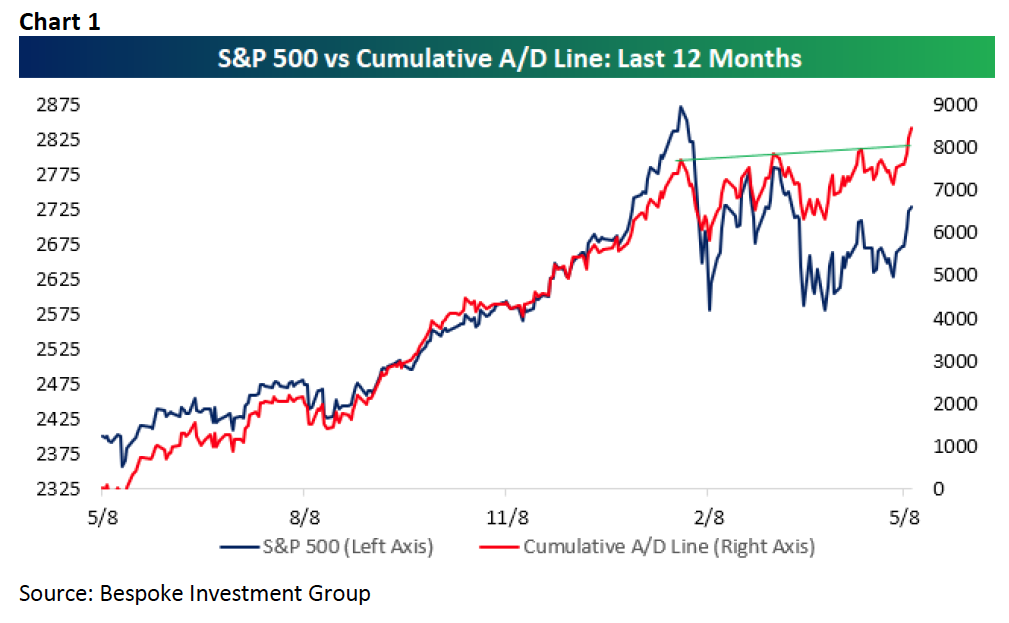
Moving on to the stock market, the most important chart of last week is the Cumulative Advance/Decline Line chart, which made new highs (Chart 1 on page 2). As Bespoke Investment Group writes:
One of the most bullish aspects of the market throughout the sell-off from the January highs right up through Friday has been the S&P 500’s cumulative A/D line. We’ve highlighted the strength in this indicator a number of times in the last three to four months, but as the chart illustrates, since the S&P 500’s peak in late January, the cumulative A/D line has made three new highs now.
Also on the bullish side of the equation are earnings. It was a few years ago we opined the equity markets had transitioned from an interest rate-driven to an earnings-driven secular bull market, and the most recent earnings quarter did not disappoint. To be sure, the percentage of companies beating their estimates stands at 68.2% (Chart 2 on page 3), while the percentage of companies beating revenue estimates stands at 71.6% (Chart 3). Moreover, the spread between the percentages of companies raising earnings guidance versus those lowering guidance continues to expand (Chart 4). This is the mother’s milk of secular bull markets!
As our friend Jason Goepfert writes in his must have letter notes:
A breakout in breadth. The Cumulative Advance/Decline Line has made a new all-time high. Since 1940, that has led to a smaller chance of a large decline going forward, and a smaller average drawdown. When the S&P has lagged the A/D Line like now, it has been less consistent. We’re also seeing lagging breadth in the bond market.
As we wrote last week, “upside breakouts” are everywhere in the charts with many of the indices breaking out of symmetrical triangles. Leon Tuey highlighted this observation over the weekend when he wrote:
Also encouraging is that most market indices have broken out of the so-called “triangle” chart patterns that everyone was watching with bated breath. Moreover, they have broken above the moving average of the weekly Bollinger Bands. One of the theories of the Bollinger Bands is that when that happens, it will test the upper Bollinger Band.
No wonder they all broke out of the “triangle” pattern. If the chartists have known this, they would have been certain that the market indices would breakout on the upside instead of sitting around picking daisy petals nervously.
Additionally, all our proprietary models are in upside breakout mode, despite the negative market pundits who continue to caution for a stock market crash. We continue to think the path of least resistance remains on the upside and continue to trade, and invest, accordingly.
The call for this week: During the entire month of January, we warned about the potential for a February Flop. That “flop” occurred right on time, followed by one of the most classic bottoming sequences we have ever witnessed, and we said so in these missives. Repeatedly, we have stated that we are treating the February 9, 2018 ‘undercut low’ at ~2533 as THE low until proven wrong and have recommitted the cash raised in January accordingly. As of last week, the D-J Industrials (INDU/24831.17) and the S&P 500 (SPX/2729.40) both have moved above their respective mid-April highs in what looks to be the completion of the bottoming chart formation that began in February. Importantly, those indices have seen a positive expansion in breadth. Stocks recording new highs are also suggestive of higher prices even though the stock market is overbought on a near-term basis. We think investors should focus on those sectors that are showing the greatest number of stocks making new highs: Energy, Financials, and Technology. The SPX futures are higher this morning (+6.00 points at 5:37 a.m.) as President Trump takes a softer tone towards China and Iran.