


Weekly Market Updates
“Pullbacks, Indicators, Barometers, and Fear”
To all of those emailers/callers we were unable to respond to – apologies – but, the fact of the matter is we were doing five or six events a day, interspersed with a massive amount of phone calls, and then drive to the next event.
While there were many questions about the bond/stock/commodity markets, the economy, earnings, etc., by far the most questions were about the December Low Indicator, because we broke below the December low last week. Recall, we brought this indicator to the attention of Jeff and Yale Hirsch decades ago and they have published it in The Stock Trader’s Almanac ever since. Since then it has been quoted by many Wall Street pundits, yet Lucien Hooper’s December Low Indicator would likely have been lost if not scribed by us a long, long time ago. We like this story:
It was back in the early 1970s, when I was working on Wall Street that I encountered Lucien. At that time Lucien, then in his 70s, was considered one of the savviest “players” in this business. While known for many market axioms and insights, the one that stuck with me was Lucien’s “December Low Indicator.” It seems like only yesterday we were
sitting at Harry’s at the Amex Bar & Grill having lunch when he explained it. “Jeff,” he began, “Forget all the noise you hear about the January barometer; pay much more attention to the December low. That would be the lowest closing price for the Dow Jones during the month of December. If that low is violated during the first quarter of the New Year, watch out!”
Now the track record of Lucien’s indicator over the past 50 years is pretty good, especially when taken in concert with the January Barometer (“So goes the month of January so goes the year”). In the more recent history, however, Andrew Adam’s comments of last Friday are worth repeating. To wit:
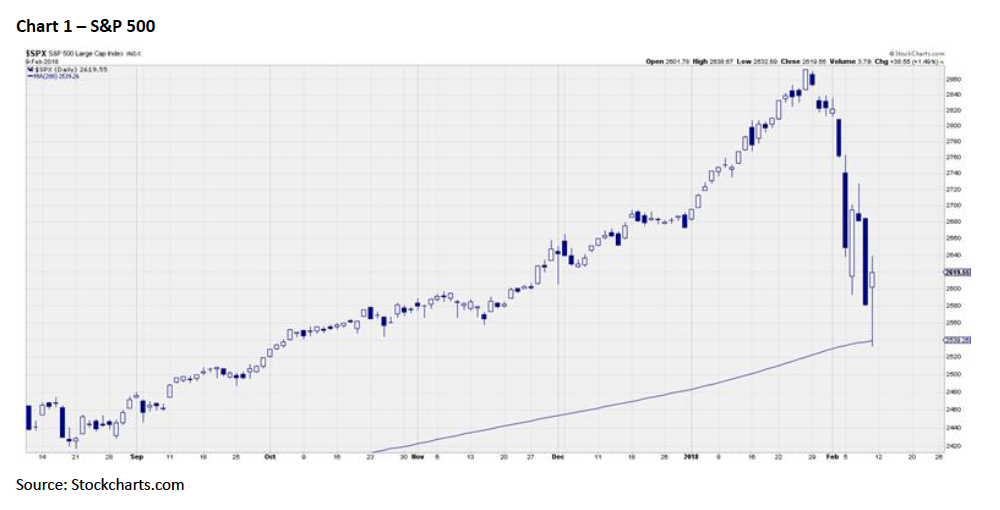
One potential red flag, however, is that that the Dow Jones Industrial Average did close below its December closing low of 24410 to give us violation of the “December Low Indicator” we referenced last month. . . . The last time it happened was only two years ago back in 2016, though the situation was very different considering January 2016 began almost right where the December 2015 low sat, and the Dow ended up closing beneath it on the third trading day of the year. That, of course, culminated in the January/February correction that ended on February 11 and saw the Dow ultimately fall about 14% from its previous trading high of early November 2015. After that, though, the market went almost straight up to finish the year comfortably higher. Overall, the December Low Indicator has a rather mixed history going back to 2000. It is actually not uncommon at all to get a violation, with 12 occurrences since 2000, and the forward returns have been surprisingly encouraging. From the point of the December low being broken, the Dow was up after three months 8 out of 12 times, up after six months 7 out of 12 times, and up after 12 months 9 out of 12 times. So, while it does bear watching, we don’t think the indicator, by itself, is enough to be overly concerned about, especially with stocks already near downside extremes.
Speaking to “downside extremes,” the envisioned February Flop came three sessions before our February 1 target, but it was within the +/- three-session window our models allow. Subsequently, we got the anticipated selling climax last Tuesday, as related on CNBC that day. Then, as is the typical pattern, the indices experienced a sharp throwback rally that we chatted about on that same CNBC appearance and said that it should fail, with the indices sliding to lower lows. “The textbook chart pattern,” we said, “would be for an undercut low of Tuesday’s selling climax low.” Well, that’s pretty much what has happened. What we find interesting is that pundits that NEVER saw this decline coming have been rushing out over the past few weeks touting various support levels; you pick the index, as well as their various stock buy ideas, all of which are pretty worthless until the equity markets exhaust themselves on the downside. Ladies and gentlemen, when the stock market gets into one of the selling stampedes, all such comments are pretty useless! So what now?
Well, while normally our mantra of “never on a Friday” should have applied to last Friday’s Flop, meaning stocks in a selling skein rarely bottom on a Friday, that mantra probably doesn’t play this time. Indeed, the bottoming process we laid out weeks ago was almost textbook, punctuated by last Friday’s undercut low. As written:
What should happen here is a selling climax low today followed by a throwback rally that fails, leading to a retest of the recent intraday lows. The perfect chart pattern would be for a marginal undercut low downside test of this early week’s trading lows, which would turn EVERYBODY bearish looking for another huge leg to the downside, yet we would BUY it, believing the worst has been seen in a continuing secular bull market.
And then there was this over the weekend from Canada’s savviest oracle ever, our pal Leon Tuey:
What a tumultuous week! Don’t sweat and be happy as the correction is over and the great bull market has resumed. On Tuesday, what investors saw was a classic selling climax, which comes at the end of a selling squall. A selling climax is an emotional catharsis when investors “throw the baby out with the bathwater.” Besieged by fear, investors are willing to sell at any price. They fear that their holdings will go to zero. Consequently, stocks move from weak hands into strong hands. How fearful? On Monday, my phone rang off the hook and it didn’t stop ringing until 9:30 p.m. Most of the callers were practitioners in the business, retired or active, and they came from Europe, Asia, and local. That was the most phone calls that I’ve fielded in one day for more than 35 years! They were all very calm
and collected. I am flattered that they called, but the calls were instructive. Globally, investors panicked, which is very bullish. Remember what Warren Buffett advised: “Be fearful when others are greedy and be greedy when others are fearful!”
The call for this week: Well, it’s Saturday and we are still on the road. Since we are writing this from Orlando, a fitting title for the last few weeks would be “Mr. Toad’s Wild Ride” (Toad); but we digress. Speaking to yet another ubiquitous question from last week was, “Did we get a Dow Theory sell signal?” The answer, at least by our interpretation of Dow Theory, is a resounding NO! So, as stated, the bottoming process was picture perfect. We called the downturn, last Tuesday’s selling
climax, the subsequent failed throwback rally, and Friday’s undercut low (the print low below last Tuesday’s selling climax low). Indeed, “picture perfect!” Our energy models are calling for an upside energy whoosh this week, so we think the selling stampede is over!
Important Investor Disclosures
Raymond James & Associates (RJA) is a FINRA member firm and is responsible for the preparation and distribution of research created in the United States. Raymond James & Associates is located at The Raymond James Financial Center, 880 Carillon Parkway, St. Petersburg, FL 33716, (727) 567-1000. Non-U.S. affiliates, which are not FINRA member firms, include the following entities that are responsible for the creation and distribution of research in their respective areas: in Canada, Raymond James Ltd. (RJL), Suite 2100, 925 West Georgia Street, Vancouver, BC V6C 3L2, (604) 659-8200; in Europe, Raymond James Euro Equities SAS (also trading as Raymond James International), 40, rue La Boetie, 75008, Paris, France, +33 1 45 64 0500, and Raymond James Financial International Ltd., Broadwalk House, 5 Appold Street, London, England EC2A 2AG, +44 203 798 5600.
This document is not directed to, or intended for distribution to or use by, any person or entity that is a citizen or resident of or located in any locality, state, country, or other jurisdiction where such distribution, publication, availability or use would be contrary to law or regulation. The securities discussed in this document may not be eligible for sale in some jurisdictions. This research is not an offer to sell or the solicitation of an offer to buy any security in any jurisdiction where such an offer or solicitation would be illegal. It does not constitute a personal recommendation or take into account the particular investment objectives, financial situations, or needs of individual clients. Past performance is not a guide to future performance, future returns are not guaranteed, and a loss of original capital may occur. Investors should consider this report as only a single factor in making their investment decision.
For clients in the United States: Any foreign securities discussed in this report are generally not eligible for sale in the U.S. unless they are listed on a U.S. exchange. This report is being provided to you for informational purposes only and does not represent a solicitation for the purchase or sale of a security in any state where such a solicitation would be illegal. Investing in securities of issuers organized outside of the U.S., including ADRs, may entail certain risks. The securities of non-U.S. issuers may not be registered with, nor be subject to the reporting requirements of, the U.S. Securities and Exchange Commission. There may be limited information available on such securities. Investors who have received this report may be prohibited in certain states or other jurisdictions from purchasing the securities mentioned in this report.
Please ask your Financial Advisor for additional details and to determine if a particular security is eligible for purchase in your state.
The information provided is as of the date above and subject to change, and it should not be deemed a recommendation to buy or sell any security. Certain information has been obtained from third-party sources we consider reliable, but we do not guarantee that such information is accurate or complete. Persons within the Raymond James family of companies may have information that is not available to the contributors of the information contained in this publication. Raymond James, including affiliates and employees, may execute transactions in the securities listed in this publication that may not be consistent with the ratings appearing in this publication.
Raymond James (“RJ”) research reports are disseminated and available to RJ’s retail and institutional clients simultaneously via electronic publication to RJ’s internal proprietary websites (RJ Investor Access & RJ Capital Markets). Not all research reports are directly distributed to clients or third-party aggregators. Certain research reports may only be disseminated on RJ’s internal proprietary websites; however such research reports will not contain estimates or changes to earnings forecasts, target price, valuation, or investment or suitability rating. Individual Research Analysts may also opt to circulate published research to one or more clients electronically. This electronic
communication distribution is discretionary and is done only after the research has been publically disseminated via RJ’s internal proprietary websites. The level and types of communications provided by Research Analysts to clients may vary depending on various factors including, but not limited to, the client’s individual preference as to the frequency and manner of receiving communications from Research Analysts. For research reports, models, or other data available on a particular security, please contact your RJ Sales Representative or visit RJ Investor Access or RJ Capital Markets.
Links to third-party websites are being provided for information purposes only. Raymond James is not affiliated with and does not endorse, authorize, or sponsor any of the listed websites or their respective sponsors. Raymond James is not responsible for the content of any third-party website or the collection or use of information regarding any website’s users and/or members.
Additional information is available on request.