Weekly Market Updates
“Selling”
*Stocks are bought not in fear but in hope. No matter what the stock did in the past it assumes a new life once a purchaser owns it, and he looks forward to a rosy future – after all, that’s why he singled it out in the first place. But these simple expectations become complicated by what actually happens. The stock acquires a new past, beginning from the moment of purchase, and with that past come new doubts, new concerns, and conflicts. The purchaser’s stock portfolio quickly becomes a portfolio of psychic dilemmas, with ego, superego, and reality in a state of constant battle.
*The public is most comfortable when they are sitting with losses, because if their stocks are down from where they bought them, they don’t have to worry about selling them. Once he’s got a loss, the typical investor is sure he isn’t going to sell. He bears the lower price because in his mind it is temporary and ridiculous: it’ll eventually go away if he doesn’t worry about it. So selling at a loss becomes absolutely out of the question. And since it is out of the question, and his mind is made up for him, the struggle of any potential decision vanishes and he’s able to sit comfortably with the loss.
*To the public mind, selling is NEVER sound. It always conveys the possibility of being wrong twice: first, admitting that they’ve made a buying error; second, admitting that they might be wrong in selling out. And if the stock has actually gone up, they’re tormented: should they take the profit or hold for a bigger one? That creates anxiety, and anxiety breeds mistakes. But as long as they’ve got losses, and never have to decide, they can sit back comfortably and dream instead.
*Through the entire market cycle lurks the fear of finalizing the deed of taking if from dream to reality by selling. BY not selling, by tightly holding on to his stocks, the investor never has to face reality.
And “selling” was the theme for October, because since the September peak the Russell 3000 lost about $3.5 trillion in market capitalization. Technology was hit the worst, losing some $759 billion, with Financials in second place at $580 billion. In fact, there was only one sector that saw an increase over the same timeframe and that was Utilities, but we digress.
To repeat, “Up until last Monday (October 29, 2018) we had focused on our short-term model’s ‘sell signal’ of October 2, 2018.” That focus changed a week ago because last Monday was the eighteenth session in the “selling stampede;” and to state to the point of ad nauseam:
Selling stampedes tend to last 17 – 25 sessions with only 1 – 3 session counter trend pauses/rally attempts before they exhaust themselves on the downside. It just seems to be the rhythm of the thing in that it seems to take that long for most folks to get bearish enough to sell and make the bottom. While it is true some selling stampedes have lasted 25– 30 sessions, it is RARE to see one last for more than 30 sessions.
Indeed, last Monday was session eighteen in the downside skein and at that point the various markets registered some of the most extreme oversold, and negative sentiment readings seen in recent history. Moreover, the 14-day Stochastic crossed above its moving average (read: short-term buy signal). Of interest is that despite last Monday’s half a percent price drop by the SPX, the session had positive breadth. We would term that a positive breadth divergence and it reinforces our sense that the “selling stampede” is over. Further, if next year’s earnings estimate for the S&P 500 (SPX/2723.06) of $176.30 by Standard & Poor’s is anywhere near the mark, at last Monday’s intraday low (2603.54) the SPX was trading at 14.7 times the 2019 estimate.
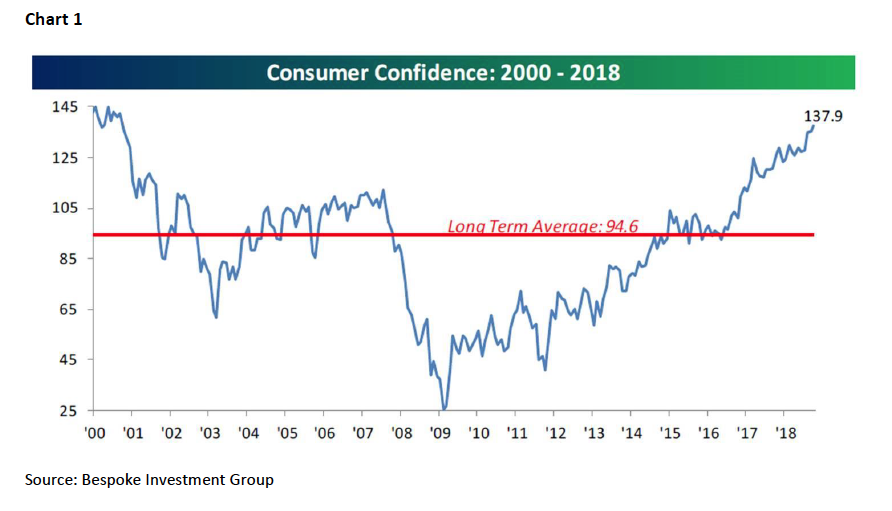
Despite the stock market’s monthly meltdown, U.S. consumers are pretty optimistic as can be seen in Chart 1. Notice how their confidence picked up following the November presidential election. Clearly some of that confidence is driven by the strong employment situation, punctuated by Friday’s better than expected employment report. As our friends at the invaluable Bespoke Investment Group write:
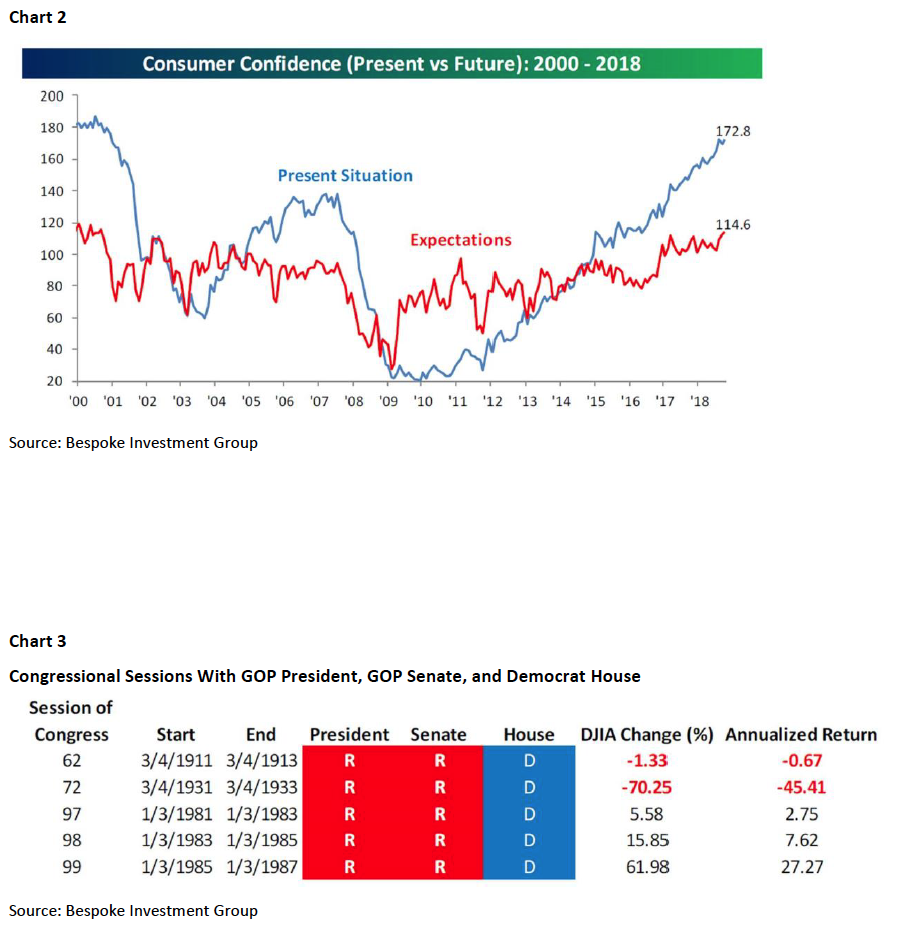
Both the indices of Confidence in the Present Situation and Expectations hit new highs for the cycle in October. In terms of the Present Situation, that index reached its best level since December 2000 while the index for Expectations hit its best level since September 2000. US consumers are a lot more positive about the present than they are the future [Chart 2].
This week, however, such economic reports will likely be ignored while the Street puts on “rabbit ears” for the mid-term election results. Here too, Bespoke has some interesting comments:
Looking at each of the individual periods where Republicans controlled the Oval Office and Senate while Democrats had the House shows that the averages are a bit misleading. The main reason for the Dow’s weak average return is the 70% decline during the 72nd session of Congress during the midst of the Great Depression. The 99th session of Congress where the DJIA rallied more than 60% also skews the results substantially. With such a small sample size and such varied results, it’s pretty hard to read much of anything into the DJIA’s performance during these periods as a blueprint for what to expect this time around. A better set-up based on historical returns would be either party actually controlling both chambers in [Chart 3] the next session.
The call for this week: Last week the SPX attempted to close above 2750, which we deemed to be an important resistance level that would bring into view the next resistance level of 2800 – 2820. Yet the rally attempt failed to better 2750, which is usually the case on the first attempt to clear such a level. It also stopped short of its 200-day moving average (DMA) at 2764.66. On a bullish note the Buying Power Index has crossed above the Selling Pressure Index and the Cumulative Net Volume Index has held up very well. And, the percentage of stocks above their respective 10-DMAs is pretty bullish, as is the same for stocks trading above their 30-DMAs. We think the “lows” are in, but the ideal bottoming process would be a rally into the 2800 – 2820 zone followed by a pullback to the 2600 – 2650 level.