Weekly Market Updates
“T. Boone Pickens”
I actually met Boone years ago through ex-CNBC anchor Consuelo Mack. Consuelo became friends with T. Boone when she was working as a reporter in Dallas, but I digress. I bring up Boone this morning because tomorrow we are doing a conference call with BP Capital (Boone Pickens Capital). Details can be found in the post scriptum of this missive. We are doing this because we believe there is a huge disconnect between the price of crude oil and the current valuation levels of the energy stocks. As often stated in these reports, “The energy stocks are basically trading at the same valuation levels that they were when crude oil was trading at $26 per barrel. Now, however, crude oil changes hands at almost $66 per barrel.” Moreover, our Houston- based energy analysts think the price of crude is going higher. Also in that camp is Cornerstone Analytics’ Mike Rothman, who is considered one of the best energy analysts around and his daily letter is a must read. In a recent report he writes:
US inventories are continuing to decline at an impressive rate. During the first two weeks of March, US oil storages have decreased counter-seasonally by 11.5 million barrels; usually we see a build in March of about 6.6 million barrels. Keep in mind that these March declines are in addition to impressive January and February inventory numbers. More importantly, Mike doesn’t see the draws letting up anytime soon. [Given] tightening global supplies, and large producers like Venezuela continuing to falter, the oil bear argument is becoming harder and harder to swallow.
Also worth mentioning is that many oil company insiders are buying their own stock. From the Raymond James energy research universe of stocks that have Strong Buy ratings from our fundamental analysts, the founder and CEO of Parsley Energy (PE/$27.32/Strong Buy) recently bought $5 million of his company’s stock in his first ever open market purchase. For the record, the importance of an open market purchase is that the insider is voluntarily buying shares at the current market price. Continental Resources’ (CLR/$58.00/Strong Buy) founder and CEO, namely Harold Hamm, made an open market purchase of nearly $8 million worth of his company’s stock. Evidentially, these gentlemen believe the future looks pretty bright for their companies and our fundamental analysts agree.
Moving on to the stock market, last week was rough with both the S&P 500 (SPX/2588.26) and the D-J Industrial Average (INDU/23533.20) losing more than 5%; their largest weekly loss since January 2016. Reasons offered for the weekly decline included: Facebook’s Face-plant; a tad more hawkish Fed; tariffs; the Whitehouse shakeup; slowing manufacturing surveys; etc. In studying some individual stock charts, it is quite amazing how much damage was done to select stocks in such a short period of time. The weekly wilt saw the Industrials break below their February 8 closing low of 23860.46, but the SPX did not breach its February 8 closing of 2581.00, although it is close to doing so. In fact, ALL of the major indices we follow were in the red last week, as were ALL of the macro sectors. The only index we monitor that gained last week was the Goldman Sachs Commodity Index (+2.37%), which is consistent with our return to commodities theme. Along this line, gold and crude oil are attempting to break out to the upside in the charts.
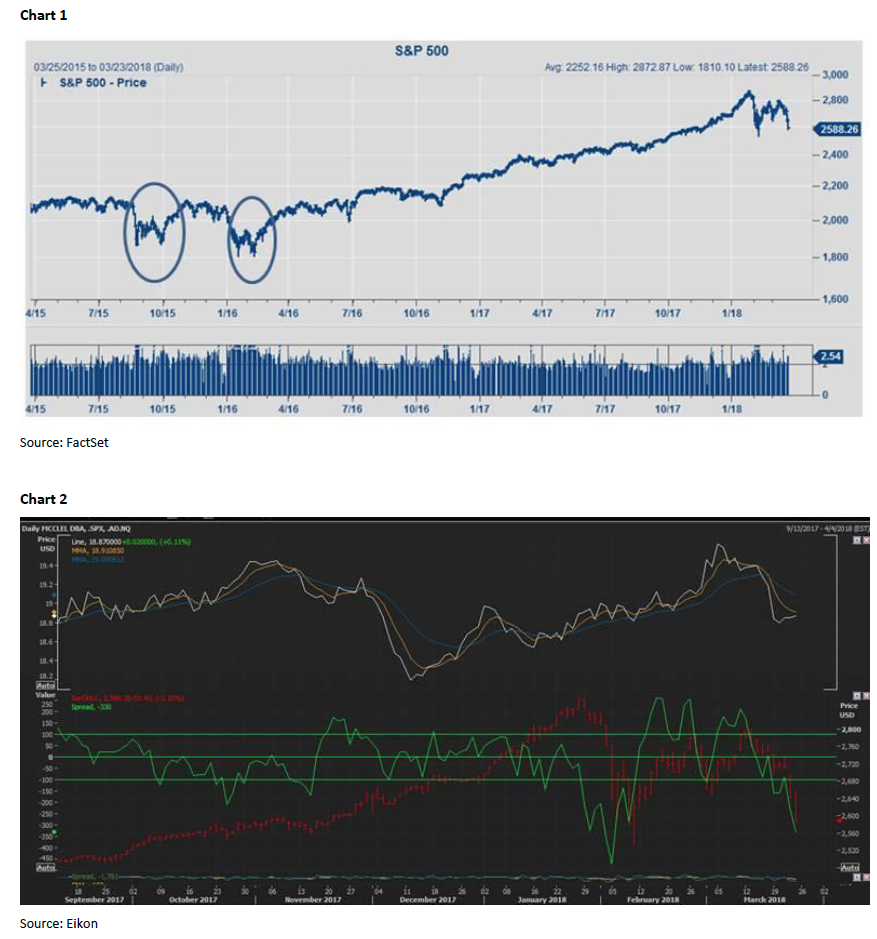
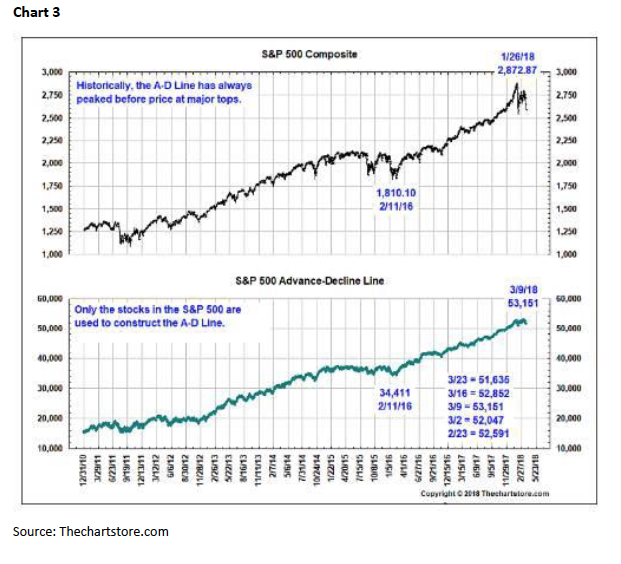
Plainly, we did not think the February lows would be retested. Obviously, we were wrong, and in this business when you are wrong you say you are wrong and you need to be wrong quickly for a de minimis loss of capital. And, before we get a bunch of questions, as of yet there is no Dow Theory “sell signal.” This week should be critical in determining how the equity markets will do in the near term. If the 2581 level fails to contain this decline, the next “fight” should take place at the February 9 intraday low at 2532.69. However, what we could be setting up for is a “W,” or double bottom, formation in the charts. We saw similar chart formations in the fall of 2015 and in February 2016 (chart 1 on page 3) and they both led to rallies. We would also note the McClellan Oscillator is in a fully oversold condition (chart 2) and that the S&P 500’s Advance- Decline Line did not confirm last week’s downside (chart 3 on page 4). So we will say it again, “This week is critical.” Longer term we continue to embrace the theme that the secular bull market has years left to run. And our pal Leon Tuey concurs. Recently, Leon wrote this:
As mentioned in my reports, one of the outstanding features of this great bull market is the persistence of worries. Every week, investors find something new to worry. This month, “trade war” is the worry du jour. Can it happen, of course, it can. The problem is that no one knows for sure whether it will happen and when it will happen. Also, by the time we know about it, everyone else would have found out. Meanwhile, what are investors to do?
No one can deal with the unknown or predict “black swans.” Available evidence continues to support my view that the greatest bull market is in progress and its end is nowhere near in sight. It will not end until the Fed sees fit to tighten meaningfully. But as mentioned before, the Fed will only do so when the economy overheats, inflation surges, and speculation is rampant. Keep in mind what Sir John Templeton accurately observed: “Bull markets are born from pessimism, grow on skepticism, mature on optimism, and die on euphoria.” Where are we? You be the judge.
The call for this week: We did not expect the SPX to retest its February lows. In the short term we should have paid more respect when the SPX traveled below its 20-day moving average (@ 2730) five sessions ago. It subsequently broke below its 140-DMA (currently at 2643.49) and is in jeopardy of violating its 200-DMA at 2585.22. We still favor the upside, believing the equity markets are setting themselves up for a move higher, but admittedly we have been wrong for the past five sessions.
Last Friday we got a two-step decline. The first decline ended around noon with the SPX trading around 2625 where a rally attempt began. It fizzled out at 2648 where a deeper decline commenced, carrying the SPX to ~2586 near the lows of the session, and it smacked of panic selling. And don’t forget, the major market indices are market capitalization weighted indexes; and the large caps are leading the way down. Meanwhile, the small/mid-caps continue hang in there pretty well.
If a move higher is in the cards it should become evident this week with a double-bottom, or “W,” formation in the chart of the SPX. And this morning stocks are sharply higher on the easing of trade war fears.
P.S. – March 27 at 3:00 p.m. (ET). You can register at (BP Capital call). After registering, you will receive a confirmation email containing information about joining the webinar.
Participants can use their telephone.
United States: +1 (213) 929-4212
Access Code: 628-675-986
Audio PIN: Shown after joining the webinar