


Weekly Market Updates
The Fantasy Football Portfolio
The FSTA’s research also uncovered some interesting and somewhat surprising data points about the characteristics of those millions of players:
- 66% male/34% female
- Average age: 6
- College degree or more: 66%
- Have a household income of $75k+: 51%
- Have full-time employment: 67%
- Average annual spending per fantasy player (age 18+): $556
If you do the math, that means people are spending almost $33 billion of their hard-earned money on a game that actually has the word “fantasy” in the title, and if that’s not a sign that the economy is doing ok, I don’t know what it is.
Of course, I’m not just talking about fantasy football here because it’s been a slow week in the financial markets (although it has been). There are many parallels between creating a winning team and creating a winning investment portfolio, and some of the same skills translate to success in both disciplines:
- Valuation plays a big part – part of the keys to success in both is identifying those situations where the “market” may be overvaluing or undervaluing specific players or
- Past performance is not a guarantee of future returns, but it is true that the top players and stocks often stay strong for
- Mistakes and unexpected hiccups will occur along the way – maybe one of your top draft picks gets injured or one of your top stocks releases disappointing earnings Flexibility and the ability to regularly reevaluate are crucial.
- Takes maintenance over time to really find success – it’s said that fantasy football championships aren’t won at the draft because there are still plenty of decisions to be made throughout the Similarly, one’s investment goals aren’t met when first picking a portfolio. It requires modifications over time as situations change.
- Developing a personal strategy that works for you is one of the keys to Do you take on more risk by drafting a guy (buying a stock) that may have a lot of upside but has a history of volatility (or no history in the case of a rookie or an IPO) or do you stick with the blue chip players (stocks) that may not have the high ceiling that they once did but should be more dependable on a regular basis and provide a steady return? The former strategy may be what it takes to beat out everyone and win a league (generate outsized returns), but the latter strategy may maximize one’s chances at making the playoffs and at least having a chance to win it all (or maximizing the chance at achieving one’s long-term goals).
In the spirit of the game and draft season, we decided to put together a “Fantasy Football Portfolio” that consists of a few
investment ideas that could form the foundation of our “team.” The idea is supposed to be fun, but keep in mind these are all companies rated Strong Buy by our fundamental analysts, and we also tried to find situations where the charts are looking interesting as well. You may not want to actually create a portfolio out of the handful of stocks, but at least it may provide you with some ideas if you’re looking to put cash to work at some point soon. And just like you can’t pick all quarterbacks or all wide receivers in fantasy football, we tried to spread our picks out across several different asset classes and sectors to provide some level of diversification.
“QB”: The quarterback is the only player to touch the ball on every snap, so, naturally, they tend to score fairly consistently from week-to-week and have a relatively high floor. For our “quarterback,” we looked for a stock in our Strong Buy-rated coverage universe that had a history of consistency (even though future consistency is certainly not guaranteed) and came up with Republic Services Inc. (RSG/$64.37/Strong Buy). Its trend over the last few years has been up, and, when combined with a decent dividend, feels like a good core holding for our team.
“RB”: The running backs are the fantasy football workhorses, with potential for big gains but also slightly risky due to injury concerns, shared workload, and the occasional game when going up against a great run defense. For purposes of our portfolio, we looked for stocks with nice upside potential but that may require taking on a little more risk. Salesforce.com (CRM/$94.10/Strong Buy) has been pretty volatile the last couple of years, but is currently breaking out to new highs at a time when not many stocks are, so we’ll put that in one RB slot. And for the other, Alibaba Group Holdings Ltd.
(BABA/$171.74/Strong Buy). BABA has performed very well over the last year and retains upside potential, but it’s also extremely overbought right now and there’s a threat of some reversion to the mean.
“WR”: Except for a handful of top guys each year, wide receivers are usually pretty boom or bust since they’re going to touch the ball less than the quarterback and running backs on a weekly basis. They can win you a week but can also put up a low point total that can severely limit your chances for success. In the stock market, these are the high risk/high reward companies that can really help you beat the averages if you catch one right, but you also must cut the positions quickly if they start to go south on you. For our “wide receivers,” we’ll take: Applied Optoelectronics Inc. (AAOI/$62.30/Strong Buy), a high- flying stock since the first half of 2016 that has now pulled back from over $100 to possible support above $60; Flexion Therapeutics (FLXN/$24.48/Strong Buy), which has also been very volatile over the last few months, but has recently been showing better technical action; and Antero Resources Corporation (AR/$19.68/Strong Buy), which is near its lowest level in the past couple of years, but last week bettered the highs of the previous two weeks in a possible sign of buying support.
“TE”: Tight ends, in the modern game, function mostly as bigger, slightly slower receivers, and they generally have less upside than running backs and wide receivers in fantasy football. Basically, we’re looking here for a large cap stock that has a history of providing consistent returns (though, once again, future returns are never guaranteed in the markets or in fantasy football). Equinix Inc. (EQIX/$466.19/Strong Buy) is a $36 billion company that remains in a clear uptrend, pays a decent dividend, and seems to fit our requirements.
“Def/K”: For our purposes here, we’ll cheat a little bit and combine the team defenses, special teams, and kickers since these are positions on your fantasy football roster that are rarely going to win you your league, but that can provide consistent
returns in each matchup if selecting correctly. We’ll take Dollar General Corporation (DG/$77.67/Strong Buy), which seems to have broken its downtrend last week, and Weyerhaeuser Co. (WY/$31.70/Strong Buy), which has been range-bound the last couple of years but maintains a good dividend yield and may be nearing support just above $30.
So, those are the players on our “team,” though, of course, you’ll want to make sure they fit into your “team” before pulling the trigger and “drafting” them. We also maintain some restraint right now when it comes to the overall markets since the averages haven’t really provided clear signs of the low being made, but, of course, there may be individual attractive situations that justify being a little more aggressive.
Overall, not much has really changed since last Monday’s comments, with the S&P 500 right about in the middle of its trading range over the last two weeks. We are being patient for now, though it’s starting to feel practically EVERYONE assumes the market is about to head down, even the bulls, like us, that have pointed out the long-term tailwinds still in place. We actually don’t recall seeing one near-term positive opinion across all our go-to research sources, which may mean sentiment has swung way too far in the negative direction (or maybe we just have really good research sources). U.S. equity funds have also seen 10 straight weeks of outflows, according to Bank of America Merrill Lynch, the longest such streak since 2004.
Remember, though, the major averages can sometimes correct “in time” rather than “in price” and perhaps that’s what we’re experiencing right now considering the S&P 500 really hasn’t gone anywhere since the beginning of June. Under the surface of the market, however, individual stocks have been correcting, with the percentage of stocks on the NYSE above their 50-day moving averages shrinking from 75% on July 19 to 39% on August 17. Stocks in the S&P 500 were also down an average of 12.5% from their 52-week highs on Friday August 18 and that number has not really improved much since then despite the S&P 500, itself, closing up last week.
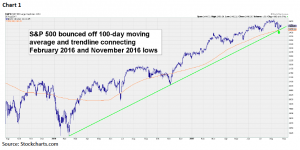
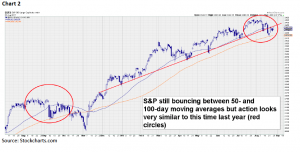
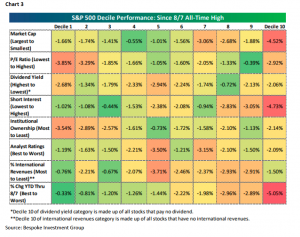
The call for this week: When we add everything up, the near-term picture appears to remain neutral. Not enough damage has been done to throw up major red flags or break the intermediate-term trend (see chart 1 on the next page), and, as mentioned, sentiment does seem to already be rather negative right now. However, the nearer-term S&P 500 support line was broken last week and the index remains below its 50-day moving average, supporting at least some caution. The action is reminiscent of what we experienced around this time last year, as an August slowdown in U.S. stocks eventually turned into a mild two-month down-move that took us into the pre-election low (see chart 2). Breadth indicators and measures of demand also did not really pick up last week despite the higher finish and Bespoke Investment Group notes that since the S&P 500 made its last closing high on August 7, stocks with the most institutional ownership have noticeably underperformed, possibly signaling the smart money has been exiting lately (see decile chart 3 on page 5). The week before Labor Day is often rather quiet and light on volume, so, if that should happen this week, any moves should probably be taken with a grain of salt. Yet, the economic calendar is actually fairly busy, culminating in the Friday jobs report, which will provide some news worth monitoring. The damage from Hurricane Harvey will be assessed as well, with gasoline futures surging to a two-year high while oil prices are actually down (we’re still thinking of our friends in Texas and hope everyone is doing ok). All in all, it’s a very similar story to the last two weeks; we remain cautious, but do not advise you to get bearish.
Important Investor Disclosures
Raymond James & Associates (RJA) is a FINRA member firm and is responsible for the preparation and distribution of research created in the United States. Raymond James & Associates is located at The Raymond James Financial Center, 880 Carillon Parkway, St. Petersburg, FL 33716, (727) 567-1000. Non-U.S. affiliates, which are not FINRA member firms, include the following entities that are responsible for the creation and distribution of research in their respective areas: in Canada, Raymond James Ltd. (RJL), Suite 2100, 925 West Georgia Street, Vancouver, BC V6C 3L2, (604) 659-8200; in Europe, Raymond James Euro Equities SAS (also trading as Raymond James International), 40, rue La Boetie, 75008, Paris, France, +33 1 45 64 0500, and Raymond James Financial International Ltd., Broadwalk House, 5 Appold Street, London, England EC2A 2AG, +44 203 798 5600.
This document is not directed to, or intended for distribution to or use by, any person or entity that is a citizen or resident of or located in any locality, state, country, or other jurisdiction where such distribution, publication, availability or use would be contrary to law or regulation. The securities discussed in this document may not be eligible for sale in some jurisdictions. This research is not an offer to sell or the solicitation of an offer to buy any security in any jurisdiction where such an offer or solicitation would be illegal. It does not constitute a personal recommendation or take into account the particular investment objectives, financial situations, or needs of individual clients. Past performance is not a guide to future performance, future returns are not guaranteed, and a loss of original capital may occur. Investors should consider this report as only a single factor in making their investment decision.
For clients in the United States: Any foreign securities discussed in this report are generally not eligible for sale in the U.S. unless they are listed on a U.S. exchange. This report is being provided to you for informational purposes only and does not represent a solicitation for the purchase or sale of a security in any state where such a solicitation would be illegal. Investing in securities of issuers organized outside of the U.S., including ADRs, may entail certain risks. The securities of non-U.S. issuers may not be registered with, nor be subject to the reporting requirements of, the U.S. Securities and Exchange Commission. There may be limited information available on such securities. Investors who have received this report may be prohibited in certain states or other jurisdictions from purchasing the securities mentioned in this report.
Please ask your Financial Advisor for additional details and to determine if a particular security is eligible for purchase in your state.
The information provided is as of the date above and subject to change, and it should not be deemed a recommendation to buy or sell any security. Certain information has been obtained from third-party sources we consider reliable, but we do not guarantee that such information is accurate or complete. Persons within the Raymond James family of companies may have information that is not available to the contributors of the information contained in this publication. Raymond James, including affiliates and employees, may execute transactions in the securities listed in this publication that may not be consistent with the ratings appearing in this publication.
Raymond James (“RJ”) research reports are disseminated and available to RJ’s retail and institutional clients simultaneously via electronic publication to RJ’s internal proprietary websites (RJ Investor Access & RJ Capital Markets). Not all research reports are directly distributed to clients or third-party aggregators. Certain research reports may only be disseminated on RJ’s internal proprietary websites; however such research reports will not contain estimates or changes to earnings forecasts, target price, valuation, or investment or suitability rating. Individual Research Analysts may also opt to circulate published research to one or more clients electronically. This electronic communication distribution is discretionary and is done only after the research has been publically disseminated via RJ’s internal proprietary websites. The level and types of communications provided by Research Analysts to clients may vary depending on various factors including, but not limited to, the client’s individual preference as to the frequency and manner of receiving communications from Research Analysts. For research reports, models, or other data available on a particular security, please contact your RJ Sales Representative or visit RJ Investor Access or RJ Capital Markets.
Additional information is available on request.